
|
Surya Roshni Limited (Suryarosni.ns) Avaliação DCF |
Totalmente Editável: Adapte-Se Às Suas Necessidades No Excel Ou Planilhas
Design Profissional: Modelos Confiáveis E Padrão Da Indústria
Pré-Construídos Para Uso Rápido E Eficiente
Compatível com MAC/PC, totalmente desbloqueado
Não É Necessária Experiência; Fácil De Seguir
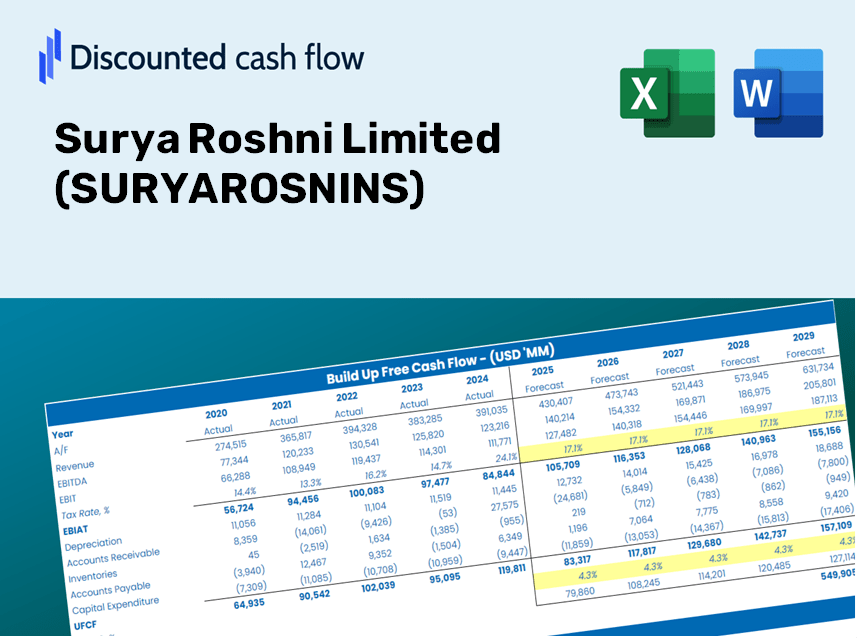
Surya Roshni Limited (SURYAROSNI.NS) Bundle
Procurando determinar o valor intrínseco da Surya Roshni Limited? Nossa calculadora DCF (Suryarosninas) integra dados do mundo real com extensos recursos de personalização, permitindo refinar suas previsões e aprimorar suas estratégias de investimento.
Discounted Cash Flow (DCF) - (USD MM)
| Year | AY1 2021 |
AY2 2022 |
AY3 2023 |
AY4 2024 |
AY5 2025 |
FY1 2026 |
FY2 2027 |
FY3 2028 |
FY4 2029 |
FY5 2030 |
|---|---|---|---|---|---|---|---|---|---|---|
| Revenue | 55,430.9 | 77,117.1 | 79,746.3 | 78,092.7 | 73,852.4 | 80,319.8 | 87,353.6 | 95,003.4 | 103,323.0 | 112,371.2 |
| Revenue Growth, % | 0 | 39.12 | 3.41 | -2.07 | -5.43 | 8.76 | 8.76 | 8.76 | 8.76 | 8.76 |
| EBITDA | 3,778.6 | 4,400.2 | 6,127.1 | 5,863.1 | 5,792.1 | 5,711.8 | 6,212.0 | 6,756.0 | 7,347.6 | 7,991.1 |
| EBITDA, % | 6.82 | 5.71 | 7.68 | 7.51 | 7.84 | 7.11 | 7.11 | 7.11 | 7.11 | 7.11 |
| Depreciation | 1,027.0 | 1,083.8 | 1,154.1 | 1,172.7 | 1,227.4 | 1,264.1 | 1,374.8 | 1,495.2 | 1,626.1 | 1,768.5 |
| Depreciation, % | 1.85 | 1.41 | 1.45 | 1.5 | 1.66 | 1.57 | 1.57 | 1.57 | 1.57 | 1.57 |
| EBIT | 2,751.6 | 3,316.4 | 4,973.0 | 4,690.4 | 4,564.7 | 4,447.7 | 4,837.2 | 5,260.8 | 5,721.5 | 6,222.6 |
| EBIT, % | 4.96 | 4.3 | 6.24 | 6.01 | 6.18 | 5.54 | 5.54 | 5.54 | 5.54 | 5.54 |
| Total Cash | 4.9 | 4.3 | 11.1 | 449.9 | 2,963.9 | 741.8 | 806.7 | 877.4 | 954.2 | 1,037.8 |
| Total Cash, percent | .0 | .0 | .0 | .0 | .0 | .0 | .0 | .0 | .0 | .0 |
| Account Receivables | 7,611.9 | 10,089.2 | 8,710.4 | 7,227.0 | 8,984.0 | 9,503.0 | 10,335.2 | 11,240.2 | 12,224.6 | 13,295.1 |
| Account Receivables, % | 13.73 | 13.08 | 10.92 | 9.25 | 12.16 | 11.83 | 11.83 | 11.83 | 11.83 | 11.83 |
| Inventories | 8,682.2 | 9,876.0 | 11,523.3 | 10,866.9 | 9,017.2 | 11,091.3 | 12,062.6 | 13,119.0 | 14,267.8 | 15,517.3 |
| Inventories, % | 15.66 | 12.81 | 14.45 | 13.92 | 12.21 | 13.81 | 13.81 | 13.81 | 13.81 | 13.81 |
| Accounts Payable | 4,804.7 | 5,935.6 | 4,065.6 | 3,686.8 | 3,639.5 | 4,997.8 | 5,435.5 | 5,911.5 | 6,429.2 | 6,992.2 |
| Accounts Payable, % | 8.67 | 7.7 | 5.1 | 4.72 | 4.93 | 6.22 | 6.22 | 6.22 | 6.22 | 6.22 |
| Capital Expenditure | -678.0 | -575.8 | -363.9 | -619.1 | -1,511.8 | -845.9 | -920.0 | -1,000.6 | -1,088.2 | -1,183.5 |
| Capital Expenditure, % | -1.22 | -0.74666 | -0.45632 | -0.79278 | -2.05 | -1.05 | -1.05 | -1.05 | -1.05 | -1.05 |
| Tax Rate, % | 25.53 | 25.53 | 25.53 | 25.53 | 25.53 | 25.53 | 25.53 | 25.53 | 25.53 | 25.53 |
| EBITAT | 2,059.9 | 2,456.5 | 3,633.2 | 3,469.5 | 3,399.4 | 3,295.2 | 3,583.7 | 3,897.6 | 4,238.9 | 4,610.1 |
| Depreciation | ||||||||||
| Changes in Account Receivables | ||||||||||
| Changes in Inventories | ||||||||||
| Changes in Accounts Payable | ||||||||||
| Capital Expenditure | ||||||||||
| UFCF | -9,080.5 | 424.3 | 2,284.9 | 5,784.1 | 3,160.4 | 2,478.6 | 2,672.7 | 2,906.7 | 3,161.3 | 3,438.1 |
| WACC, % | 7.16 | 7.16 | 7.15 | 7.16 | 7.16 | 7.16 | 7.16 | 7.16 | 7.16 | 7.16 |
| PV UFCF | ||||||||||
| SUM PV UFCF | 11,834.5 | |||||||||
| Long Term Growth Rate, % | 3.50 | |||||||||
| Free cash flow (T + 1) | 3,558 | |||||||||
| Terminal Value | 97,340 | |||||||||
| Present Terminal Value | 68,899 | |||||||||
| Enterprise Value | 80,733 | |||||||||
| Net Debt | -2,801 | |||||||||
| Equity Value | 83,534 | |||||||||
| Diluted Shares Outstanding, MM | 218 | |||||||||
| Equity Value Per Share | 383.93 |
What You Will Receive
- Authentic Surya Roshni Data: Comprehensive financials – including revenue and EBIT – derived from actual and projected figures.
- Complete Customization: Modify essential parameters (yellow cells) such as WACC, growth rate, and tax percentages.
- Immediate Valuation Adjustments: Automatic updates for evaluating the effects of changes on Surya Roshni’s fair value.
- Flexible Excel Template: Designed for rapid modifications, scenario analysis, and in-depth forecasts.
- Efficient and Precise: Avoid the hassle of building models from the ground up while ensuring accuracy and adaptability.
Key Features
- 🔍 Real-Life SURYAROSNINS Financials: Pre-filled historical and projected data for Surya Roshni Limited.
- ✏️ Fully Customizable Inputs: Modify all essential parameters (yellow cells) such as WACC, growth %, and tax rates.
- 📊 Professional DCF Valuation: Integrated formulas compute Surya Roshni’s intrinsic value using the Discounted Cash Flow method.
- ⚡ Instant Results: View Surya Roshni’s valuation instantly after making adjustments.
- Scenario Analysis: Evaluate and compare outcomes for different financial scenarios side-by-side.
How It Works
- Step 1: Download the prebuilt Excel template featuring Surya Roshni Limited’s (SURYAROSNINS) data.
- Step 2: Navigate through the pre-filled sheets to familiarize yourself with the essential metrics.
- Step 3: Modify forecasts and assumptions in the editable yellow cells (WACC, growth, margins).
- Step 4: Instantly view recalibrated results, including Surya Roshni Limited’s intrinsic value.
- Step 5: Make well-informed investment choices or create reports using the generated outputs.
Why Opt for This Calculator?
- Precision: Utilizes genuine Surya Roshni Limited financial data for reliable outcomes.
- Versatility: Tailored for users to freely experiment with and adjust their inputs.
- Efficiency: Eliminate the stress of constructing a DCF model from the ground up.
- Expert-Level: Crafted with the accuracy and usability expected by CFOs.
- Intuitive: Simple to navigate, even for those lacking extensive financial modeling skills.
Who Can Benefit from This Product?
- Investors: Accurately assess Surya Roshni Limited’s (SURYAROSNINS) true value before making investment choices.
- CFOs: Utilize a high-quality DCF model for financial reporting and comprehensive analysis.
- Consultants: Efficiently customize the template for client valuation reports.
- Entrepreneurs: Discover financial modeling techniques used by leading companies.
- Educators: Serve as a teaching resource to illustrate valuation methods.
Contents of the Template
- Pre-Filled DCF Model: Surya Roshni Limited’s (SURYAROSNINS) financial data preloaded for immediate application.
- WACC Calculator: Comprehensive calculations for the Weighted Average Cost of Capital.
- Financial Ratios: Assess Surya Roshni Limited's profitability, leverage, and operational efficiency.
- Editable Inputs: Modify assumptions such as growth rates, margins, and CAPEX to suit your analysis.
- Financial Statements: Access to annual and quarterly reports for thorough examination.
- Interactive Dashboard: Effortlessly visualize essential valuation metrics and outcomes.
Disclaimer
All information, articles, and product details provided on this website are for general informational and educational purposes only. We do not claim any ownership over, nor do we intend to infringe upon, any trademarks, copyrights, logos, brand names, or other intellectual property mentioned or depicted on this site. Such intellectual property remains the property of its respective owners, and any references here are made solely for identification or informational purposes, without implying any affiliation, endorsement, or partnership.
We make no representations or warranties, express or implied, regarding the accuracy, completeness, or suitability of any content or products presented. Nothing on this website should be construed as legal, tax, investment, financial, medical, or other professional advice. In addition, no part of this site—including articles or product references—constitutes a solicitation, recommendation, endorsement, advertisement, or offer to buy or sell any securities, franchises, or other financial instruments, particularly in jurisdictions where such activity would be unlawful.
All content is of a general nature and may not address the specific circumstances of any individual or entity. It is not a substitute for professional advice or services. Any actions you take based on the information provided here are strictly at your own risk. You accept full responsibility for any decisions or outcomes arising from your use of this website and agree to release us from any liability in connection with your use of, or reliance upon, the content or products found herein.