
|
Transport Corporation of India Limited (TCI.NS) Avaliação DCF |
Totalmente Editável: Adapte-Se Às Suas Necessidades No Excel Ou Planilhas
Design Profissional: Modelos Confiáveis E Padrão Da Indústria
Pré-Construídos Para Uso Rápido E Eficiente
Compatível com MAC/PC, totalmente desbloqueado
Não É Necessária Experiência; Fácil De Seguir
Transport Corporation of India Limited (TCI.NS) Bundle
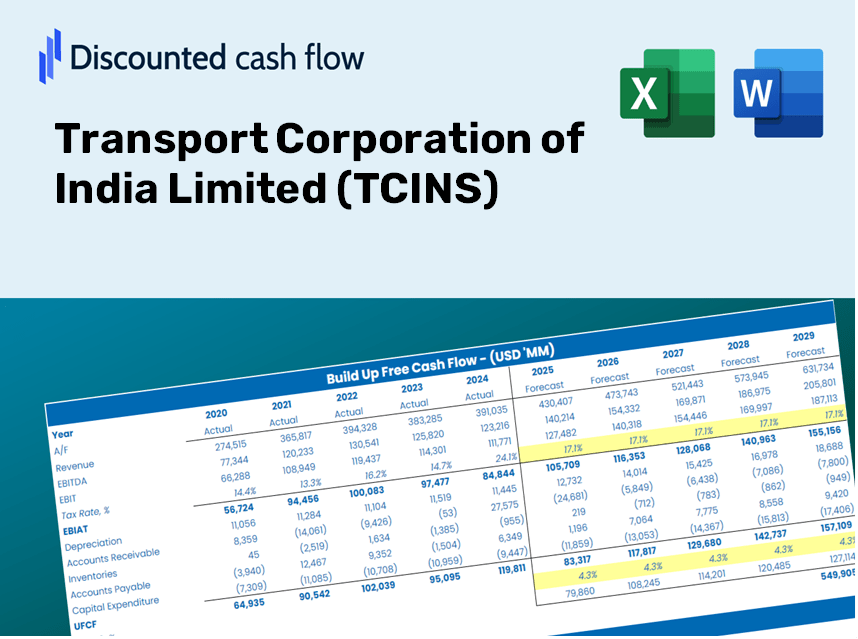
Atualize sua análise e melhore a precisão com a nossa calculadora DCF (TCINS)! Utilizando dados reais da Transport Corporation of India Limited e suposições personalizáveis, essa ferramenta permite que você preveja, avalie e avalie (TCINs) como um investidor experiente.
Benefits You Will Receive
- Comprehensive Financial Model: Leveraging TCINS's real data for accurate DCF valuation.
- Flexible Forecast Adjustments: Modify revenue growth, profit margins, WACC, and other essential parameters.
- Real-Time Calculations: Instantly see the impact of your changes with automatic updates.
- Professional-Grade Template: A polished Excel document crafted for high-quality valuation.
- Adaptable and Reusable: Designed for flexibility, enabling ongoing use for in-depth forecasts.
Key Features
- Comprehensive Financial Data: Access reliable, pre-loaded historical and projected financials for Transport Corporation of India Limited (TCINS).
- Flexible Forecast Inputs: Modify key assumptions such as WACC, growth rates, and margins in the highlighted fields.
- Real-Time Analytical Calculations: Instant updates to DCF, Net Present Value (NPV), and cash flow analyses with every adjustment.
- Interactive Visual Dashboard: User-friendly charts and summaries to help you visualize your valuation findings.
- Suitable for All Experience Levels: Designed with simplicity in mind, catering to investors, CFOs, and consultants alike.
How It Functions
- Step 1: Download the Excel file.
- Step 2: Examine the pre-filled data for Transport Corporation of India Limited (TCINS) (historical and projected).
- Step 3: Modify key assumptions (yellow cells) based on your analysis.
- Step 4: Observe automatic recalculations for the intrinsic value of Transport Corporation of India Limited (TCINS).
- Step 5: Utilize the results for your investment decisions or reporting needs.
Why Choose the TCINS Calculator?
- Accuracy: Utilizes reliable financial data from Transport Corporation of India Limited (TCINS) for precise calculations.
- Flexibility: Allows users to effortlessly adjust and test various inputs according to their needs.
- Time-Saving: Eliminate the complexity of constructing a model from the ground up.
- Professional-Grade: Created with the expertise and attention to detail expected at the CFO level.
- User-Friendly: Intuitive interface designed for users with any level of financial modeling experience.
Who Would Benefit from This Product?
- Institutional Investors: Develop comprehensive and accurate valuation models for investment assessments.
- Financial Analysts: Evaluate valuation scenarios to support strategic decision-making within the company.
- Consultants and Financial Advisors: Equip clients with precise valuation analysis for Transport Corporation of India Limited (TCINS).
- Students and Academic Professionals: Leverage real-world case studies to enhance learning and practice in financial modeling.
- Logistics and Transportation Buffs: Gain insights into the valuation of companies like Transport Corporation of India Limited (TCINS) within the logistics sector.
Contents of the Template
- Pre-Filled Data: Contains historical financials and projections for Transport Corporation of India Limited (TCINS).
- Discounted Cash Flow Model: An editable DCF valuation model featuring automatic calculations.
- Weighted Average Cost of Capital (WACC): A specialized sheet for WACC calculation based on user-defined inputs.
- Key Financial Ratios: Evaluate TCINS's profitability, operational efficiency, and financial leverage.
- Customizable Inputs: Easily modify revenue growth rates, margins, and tax rates.
- Clear Dashboard: Visual charts and tables presenting essential valuation results.
Disclaimer
All information, articles, and product details provided on this website are for general informational and educational purposes only. We do not claim any ownership over, nor do we intend to infringe upon, any trademarks, copyrights, logos, brand names, or other intellectual property mentioned or depicted on this site. Such intellectual property remains the property of its respective owners, and any references here are made solely for identification or informational purposes, without implying any affiliation, endorsement, or partnership.
We make no representations or warranties, express or implied, regarding the accuracy, completeness, or suitability of any content or products presented. Nothing on this website should be construed as legal, tax, investment, financial, medical, or other professional advice. In addition, no part of this site—including articles or product references—constitutes a solicitation, recommendation, endorsement, advertisement, or offer to buy or sell any securities, franchises, or other financial instruments, particularly in jurisdictions where such activity would be unlawful.
All content is of a general nature and may not address the specific circumstances of any individual or entity. It is not a substitute for professional advice or services. Any actions you take based on the information provided here are strictly at your own risk. You accept full responsibility for any decisions or outcomes arising from your use of this website and agree to release us from any liability in connection with your use of, or reliance upon, the content or products found herein.