
|
Thomas Cook Limited (Thomascook.NS) Avaliação DCF |
Totalmente Editável: Adapte-Se Às Suas Necessidades No Excel Ou Planilhas
Design Profissional: Modelos Confiáveis E Padrão Da Indústria
Pré-Construídos Para Uso Rápido E Eficiente
Compatível com MAC/PC, totalmente desbloqueado
Não É Necessária Experiência; Fácil De Seguir
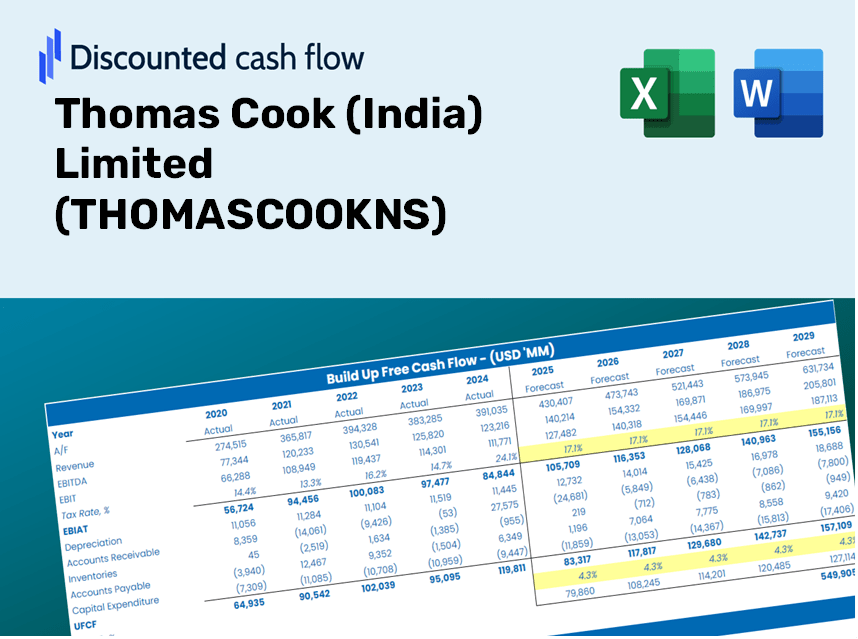
Thomas Cook (India) Limited (THOMASCOOK.NS) Bundle
Avalie as perspectivas financeiras de Thomas Cook (Índia) Limited como um especialista! Essa calculadora DCF (Thomascookns) fornece dados financeiros pré-preenchidos, juntamente com a flexibilidade para modificar o crescimento da receita, o WACC, as margens e outras suposições essenciais para se alinhar às suas previsões.
Discounted Cash Flow (DCF) - (USD MM)
| Year | AY1 2021 |
AY2 2022 |
AY3 2023 |
AY4 2024 |
AY5 2025 |
FY1 2026 |
FY2 2027 |
FY3 2028 |
FY4 2029 |
FY5 2030 |
|---|---|---|---|---|---|---|---|---|---|---|
| Revenue | 7,935.1 | 18,873.6 | 50,476.7 | 73,132.7 | 81,395.7 | 133,526.2 | 219,043.9 | 359,332.1 | 589,469.0 | 966,998.5 |
| Revenue Growth, % | 0 | 137.85 | 167.45 | 44.88 | 11.3 | 64.05 | 64.05 | 64.05 | 64.05 | 64.05 |
| EBITDA | -2,061.9 | -1,326.7 | 2,394.1 | 5,173.7 | 6,148.4 | -3,643.3 | -5,976.6 | -9,804.4 | -16,083.6 | -26,384.5 |
| EBITDA, % | -25.98 | -7.03 | 4.74 | 7.07 | 7.55 | -2.73 | -2.73 | -2.73 | -2.73 | -2.73 |
| Depreciation | 1,480.5 | 1,286.7 | 1,240.3 | 1,276.1 | 1,418.8 | 8,390.7 | 13,764.6 | 22,580.3 | 37,042.0 | 60,765.8 |
| Depreciation, % | 18.66 | 6.82 | 2.46 | 1.74 | 1.74 | 6.28 | 6.28 | 6.28 | 6.28 | 6.28 |
| EBIT | -3,542.3 | -2,613.4 | 1,153.7 | 3,897.6 | 4,729.6 | -12,034.0 | -19,741.2 | -32,384.6 | -53,125.6 | -87,150.3 |
| EBIT, % | -44.64 | -13.85 | 2.29 | 5.33 | 5.81 | -9.01 | -9.01 | -9.01 | -9.01 | -9.01 |
| Total Cash | 8,715.3 | 5,836.4 | 11,449.2 | 14,493.9 | 11,166.0 | 49,976.9 | 81,985.0 | 134,492.8 | 220,629.7 | 361,933.5 |
| Total Cash, percent | .0 | .0 | .0 | .0 | .0 | .0 | .0 | .0 | .0 | .0 |
| Account Receivables | 1,530.4 | 2,705.5 | 6,498.8 | 7,119.1 | 6,323.9 | 17,091.2 | 28,037.4 | 45,994.2 | 75,451.5 | 123,774.9 |
| Account Receivables, % | 19.29 | 14.34 | 12.87 | 9.73 | 7.77 | 12.8 | 12.8 | 12.8 | 12.8 | 12.8 |
| Inventories | 176.0 | 215.8 | 301.5 | 404.2 | 361.7 | 1,323.3 | 2,170.9 | 3,561.2 | 5,842.0 | 9,583.5 |
| Inventories, % | 2.22 | 1.14 | 0.59725 | 0.55269 | 0.44437 | 0.99106 | 0.99106 | 0.99106 | 0.99106 | 0.99106 |
| Accounts Payable | 7,757.5 | 9,668.3 | 17,865.6 | 21,567.0 | 25,080.8 | 65,343.8 | 107,193.8 | 175,846.8 | 288,469.1 | 473,221.1 |
| Accounts Payable, % | 97.76 | 51.23 | 35.39 | 29.49 | 30.81 | 48.94 | 48.94 | 48.94 | 48.94 | 48.94 |
| Capital Expenditure | -162.1 | -618.8 | -676.3 | -1,042.9 | -1,169.9 | -2,543.6 | -4,172.7 | -6,845.1 | -11,229.1 | -18,420.9 |
| Capital Expenditure, % | -2.04 | -3.28 | -1.34 | -1.43 | -1.44 | -1.9 | -1.9 | -1.9 | -1.9 | -1.9 |
| Tax Rate, % | 33.45 | 33.45 | 33.45 | 33.45 | 33.45 | 33.45 | 33.45 | 33.45 | 33.45 | 33.45 |
| EBITAT | -2,161.4 | -1,859.0 | 277.7 | 2,926.9 | 3,147.7 | -7,169.1 | -11,760.5 | -19,292.7 | -31,648.8 | -51,918.4 |
| Depreciation | ||||||||||
| Changes in Account Receivables | ||||||||||
| Changes in Inventories | ||||||||||
| Changes in Accounts Payable | ||||||||||
| Capital Expenditure | ||||||||||
| UFCF | 5,208.1 | -495.4 | 5,160.2 | 6,138.4 | 7,748.1 | 27,212.1 | 27,887.6 | 45,748.4 | 75,048.3 | 123,113.5 |
| WACC, % | 5.16 | 5.28 | 4.7 | 5.33 | 5.22 | 5.14 | 5.14 | 5.14 | 5.14 | 5.14 |
| PV UFCF | ||||||||||
| SUM PV UFCF | 247,732.4 | |||||||||
| Long Term Growth Rate, % | 3.50 | |||||||||
| Free cash flow (T + 1) | 127,422 | |||||||||
| Terminal Value | 7,783,346 | |||||||||
| Present Terminal Value | 6,058,791 | |||||||||
| Enterprise Value | 6,306,524 | |||||||||
| Net Debt | -5,384 | |||||||||
| Equity Value | 6,311,908 | |||||||||
| Diluted Shares Outstanding, MM | 466 | |||||||||
| Equity Value Per Share | 13,550.51 |
What You Will Receive
- Authentic THOMASCOOKNS Financial Data: Pre-filled with historical and projected figures for accurate analysis of Thomas Cook (India) Limited.
- Completely Customizable Template: Easily adjust key parameters such as revenue growth, WACC, and EBITDA percentage.
- Instant Calculations: Watch the intrinsic value of Thomas Cook (India) Limited update in real-time as you make adjustments.
- Professional Valuation Tool: Tailored for investors, analysts, and consultants aiming for precise DCF outcomes.
- User-Friendly Interface: Intuitive layout and straightforward instructions suitable for all skill levels.
Key Features
- Comprehensive THOMASCOOKNS Data: Equipped with Thomas Cook (India) Limited's historical performance metrics and future forecasts.
- Customizable Parameters: Modify growth rates, profit margins, discount rates, tax percentages, and capital investments.
- Adaptive Valuation Model: Instantaneous recalibration of Net Present Value (NPV) and intrinsic value according to your parameters.
- Scenario Analysis: Develop various forecasting scenarios to explore different valuation possibilities.
- Intuitive Interface: Designed for ease of use, appealing to both seasoned professionals and newcomers.
How It Works
- Step 1: Download the Excel file for Thomas Cook (India) Limited (THOMASCOOKNS).
- Step 2: Examine the pre-filled financial data and forecasts specific to Thomas Cook.
- Step 3: Adjust key inputs such as revenue growth, WACC, and tax rates (cells highlighted for convenience).
- Step 4: Observe the DCF model refresh in real-time as you modify your assumptions.
- Step 5: Review the outputs and leverage the findings for your investment decisions regarding Thomas Cook (India) Limited (THOMASCOOKNS).
Why Opt for Thomas Cook (India) Limited (THOMASCOOKNS)?
- Time-Saving: Skip the hassle of complex travel planning – our services are ready for you.
- Enhanced Accuracy: Dependable travel data and insights minimize errors in your travel arrangements.
- Fully Customizable: Adjust your travel plans to suit your unique preferences and budget.
- User-Friendly: Intuitive interface and detailed itineraries make your travel planning straightforward.
- Preferred by Professionals: Trusted by travel experts who prioritize quality service and reliability.
Who Should Use This Product?
- Individual Travelers: Make informed decisions when booking trips with Thomas Cook (THOMASCOOKNS).
- Travel Advisors: Enhance client recommendations with comprehensive travel packages and insights.
- Tour Operators: Access valuable resources to deliver exceptional travel experiences to customers.
- Business Executives: Understand the travel industry trends through the lens of a well-established company like Thomas Cook (THOMASCOOKNS) to inform your corporate travel strategies.
- Hospitality Students: Gain practical knowledge of the travel and tourism sector using case studies and data from Thomas Cook (THOMASCOOKNS).
What the Template Contains
- Historical Data: Includes Thomas Cook (India) Limited’s past financials and baseline forecasts.
- DCF and Levered DCF Models: Comprehensive templates to calculate the intrinsic value of Thomas Cook (India) Limited.
- WACC Sheet: Pre-built calculations for the Weighted Average Cost of Capital.
- Editable Inputs: Customize key drivers such as growth rates, EBITDA %, and CAPEX assumptions.
- Quarterly and Annual Statements: A thorough breakdown of Thomas Cook (India) Limited’s financials.
- Interactive Dashboard: Dynamically visualize valuation results and projections.
Disclaimer
All information, articles, and product details provided on this website are for general informational and educational purposes only. We do not claim any ownership over, nor do we intend to infringe upon, any trademarks, copyrights, logos, brand names, or other intellectual property mentioned or depicted on this site. Such intellectual property remains the property of its respective owners, and any references here are made solely for identification or informational purposes, without implying any affiliation, endorsement, or partnership.
We make no representations or warranties, express or implied, regarding the accuracy, completeness, or suitability of any content or products presented. Nothing on this website should be construed as legal, tax, investment, financial, medical, or other professional advice. In addition, no part of this site—including articles or product references—constitutes a solicitation, recommendation, endorsement, advertisement, or offer to buy or sell any securities, franchises, or other financial instruments, particularly in jurisdictions where such activity would be unlawful.
All content is of a general nature and may not address the specific circumstances of any individual or entity. It is not a substitute for professional advice or services. Any actions you take based on the information provided here are strictly at your own risk. You accept full responsibility for any decisions or outcomes arising from your use of this website and agree to release us from any liability in connection with your use of, or reliance upon, the content or products found herein.