
|
Tarkett S.A. (TKTT.PA) Avaliação DCF |
Totalmente Editável: Adapte-Se Às Suas Necessidades No Excel Ou Planilhas
Design Profissional: Modelos Confiáveis E Padrão Da Indústria
Pré-Construídos Para Uso Rápido E Eficiente
Compatível com MAC/PC, totalmente desbloqueado
Não É Necessária Experiência; Fácil De Seguir
Tarkett S.A. (TKTT.PA) Bundle
Explore o potencial financeiro de Tarkett S.A. (TKTTPA) com nossa calculadora DCF amigável! Digite suas suposições de crescimento, margens e custos para determinar o valor intrínseco de Tarkett S.A. (TKTTPA) e aprimorar sua estratégia de investimento.
What You Will Receive
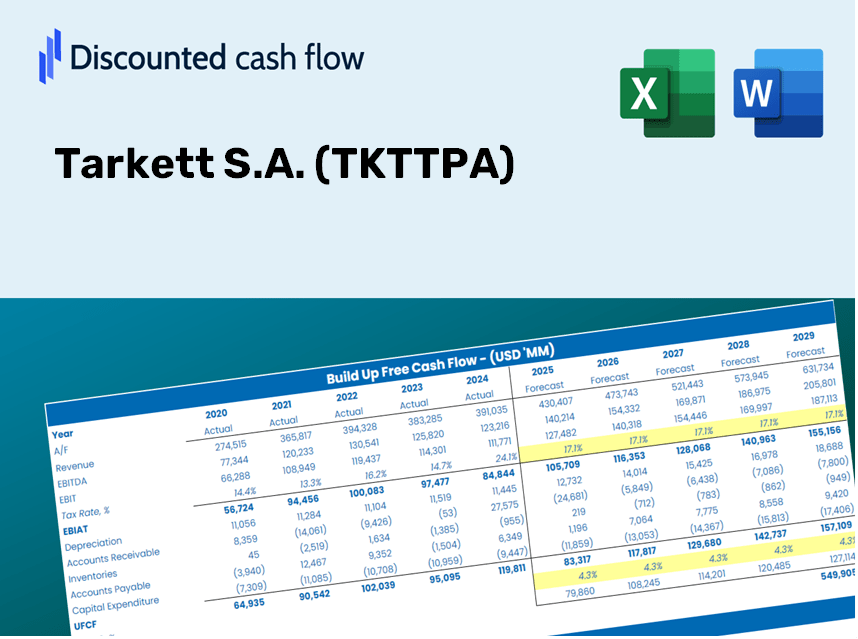
- Authentic Tarkett Data: Preloaded financial information – encompassing revenue to EBIT – derived from real and projected figures.
- Comprehensive Customization: Modify all key parameters (yellow cells) such as WACC, growth %, and tax rates.
- Immediate Valuation Adjustments: Automatic recalculations to assess the effects of modifications on Tarkett’s fair value.
- Flexible Excel Template: Designed for quick alterations, scenario analysis, and in-depth projections.
- Efficient and Precise: Bypass the complexity of building models from scratch while ensuring accuracy and adaptability.
Key Features
- Customizable Forecast Variables: Adjust essential inputs such as revenue growth, EBITDA margin, and capital expenditures.
- Instant DCF Valuation: Quickly computes intrinsic value, NPV, and other key financial metrics.
- High-Degree of Precision: Leverages Tarkett S.A.'s real-world financial data for accurate valuation results.
- Effortless Scenario Analysis: Easily test various assumptions and compare results without hassle.
- Efficiency-Boosting Solution: Remove the complexity of developing detailed valuation models from the ground up.
How It Works
- Step 1: Download the prebuilt Excel template featuring Tarkett S.A.'s (TKTTPA) data.
- Step 2: Review the pre-filled sheets to familiarize yourself with the essential metrics.
- Step 3: Modify forecasts and assumptions in the editable yellow cells (WACC, growth, margins).
- Step 4: Instantly access recalculated results, including Tarkett S.A.'s (TKTTPA) intrinsic value.
- Step 5: Utilize the outputs to make informed investment decisions or generate detailed reports.
Why Choose Tarkett S.A. (TKTTPA)?
- Time-Saving: Instantly access our solutions without the hassle of starting from scratch.
- Enhanced Precision: Our dependable data and methodologies minimize valuation discrepancies.
- Fully Adaptable: Customize our offerings to align with your specific assumptions and forecasts.
- User-Friendly: Intuitive visuals and outputs simplify result interpretation.
- Respected by Professionals: Created for experts who prioritize both accuracy and functionality.
Who Should Utilize This Product?
- Investors: Assess Tarkett S.A.’s (TKTTPA) fair value accurately prior to making investment choices.
- CFOs: Utilize a high-quality DCF model for comprehensive financial reporting and analysis.
- Consultants: Effortlessly customize the template for client valuation reports.
- Entrepreneurs: Discover financial modeling strategies employed by leading companies.
- Educators: Apply it as a teaching resource to illustrate various valuation techniques.
Contents of the Template
- Pre-Filled Data: Features Tarkett S.A.'s historical financial performance and forecasts.
- Discounted Cash Flow Model: Customizable DCF valuation model with automatic computation functionalities.
- Weighted Average Cost of Capital (WACC): A specific worksheet designed for WACC calculations based on user-defined inputs.
- Key Financial Ratios: Examine Tarkett's profitability, operational efficiency, and financial leverage.
- Customizable Inputs: Easily adjust revenue growth rates, profit margins, and tax percentages.
- Comprehensive Dashboard: Visual representations and tables that summarize essential valuation outcomes.
Disclaimer
All information, articles, and product details provided on this website are for general informational and educational purposes only. We do not claim any ownership over, nor do we intend to infringe upon, any trademarks, copyrights, logos, brand names, or other intellectual property mentioned or depicted on this site. Such intellectual property remains the property of its respective owners, and any references here are made solely for identification or informational purposes, without implying any affiliation, endorsement, or partnership.
We make no representations or warranties, express or implied, regarding the accuracy, completeness, or suitability of any content or products presented. Nothing on this website should be construed as legal, tax, investment, financial, medical, or other professional advice. In addition, no part of this site—including articles or product references—constitutes a solicitation, recommendation, endorsement, advertisement, or offer to buy or sell any securities, franchises, or other financial instruments, particularly in jurisdictions where such activity would be unlawful.
All content is of a general nature and may not address the specific circumstances of any individual or entity. It is not a substitute for professional advice or services. Any actions you take based on the information provided here are strictly at your own risk. You accept full responsibility for any decisions or outcomes arising from your use of this website and agree to release us from any liability in connection with your use of, or reliance upon, the content or products found herein.