
|
TOTALENERGIES SE (TTE) Avaliação DCF |
Totalmente Editável: Adapte-Se Às Suas Necessidades No Excel Ou Planilhas
Design Profissional: Modelos Confiáveis E Padrão Da Indústria
Pré-Construídos Para Uso Rápido E Eficiente
Compatível com MAC/PC, totalmente desbloqueado
Não É Necessária Experiência; Fácil De Seguir
TotalEnergies SE (TTE) Bundle
Explore a perspectiva financeira do TotalENergies SE (TTE) com nossa calculadora DCF amigável! Digite suas projeções de crescimento, margens e despesas para calcular o valor intrínseco do total de energia (TTE) e moldar sua abordagem de investimento.
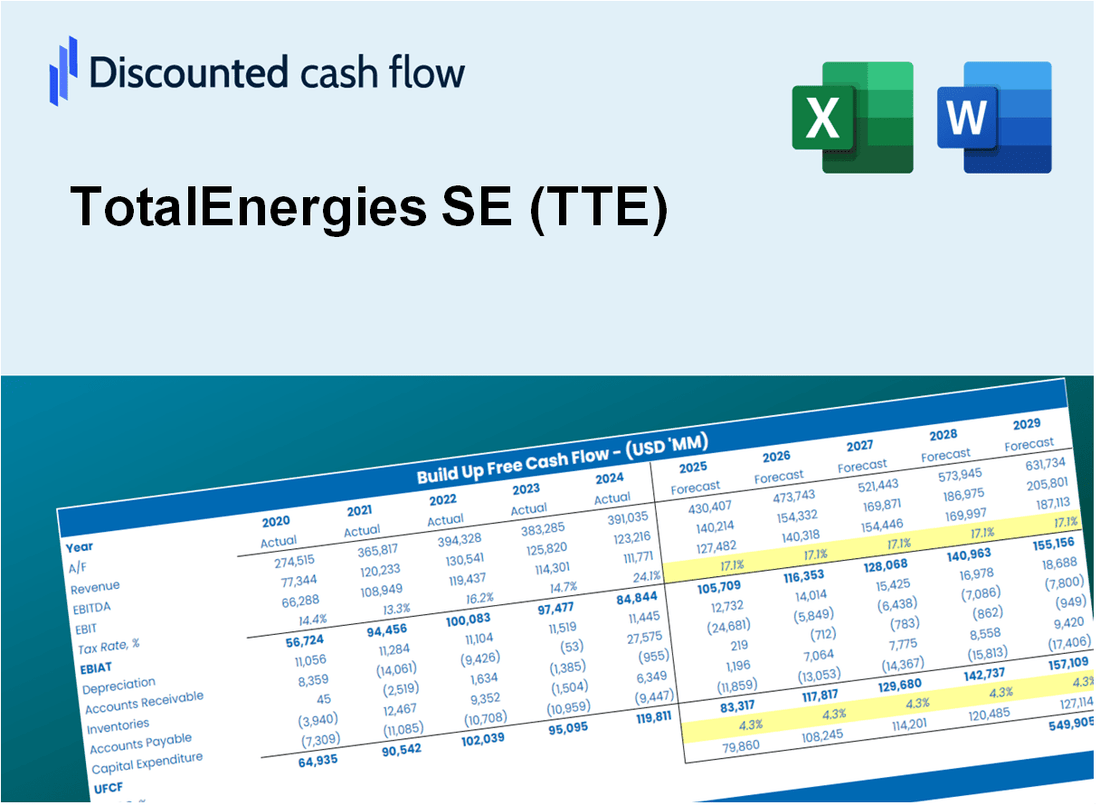
Discounted Cash Flow (DCF) - (USD MM)
| Year | AY1 2020 |
AY2 2021 |
AY3 2022 |
AY4 2023 |
AY5 2024 |
FY1 2025 |
FY2 2026 |
FY3 2027 |
FY4 2028 |
FY5 2029 |
|---|---|---|---|---|---|---|---|---|---|---|
| Revenue | 119,704.0 | 184,634.0 | 263,310.0 | 218,945.0 | 195,610.0 | 229,522.5 | 269,314.3 | 316,004.7 | 370,789.7 | 435,072.7 |
| Revenue Growth, % | 0 | 54.24 | 42.61 | -16.85 | -10.66 | 17.34 | 17.34 | 17.34 | 17.34 | 17.34 |
| EBITDA | 8,847.0 | 37,842.0 | 59,133.0 | 50,782.0 | 41,107.0 | 43,403.9 | 50,928.8 | 59,758.2 | 70,118.3 | 82,274.6 |
| EBITDA, % | 7.39 | 20.5 | 22.46 | 23.19 | 21.01 | 18.91 | 18.91 | 18.91 | 18.91 | 18.91 |
| Depreciation | 14,262.0 | 13,585.0 | 11,892.0 | 13,818.0 | 12,025.0 | 16,639.1 | 19,523.7 | 22,908.5 | 26,880.1 | 31,540.3 |
| Depreciation, % | 11.91 | 7.36 | 4.52 | 6.31 | 6.15 | 7.25 | 7.25 | 7.25 | 7.25 | 7.25 |
| EBIT | -5,415.0 | 24,257.0 | 47,241.0 | 36,964.0 | 29,082.0 | 26,764.9 | 31,405.0 | 36,849.7 | 43,238.2 | 50,734.3 |
| EBIT, % | -4.52 | 13.14 | 17.94 | 16.88 | 14.87 | 11.66 | 11.66 | 11.66 | 11.66 | 11.66 |
| Total Cash | 35,898.0 | 33,657.0 | 41,772.0 | 31,621.0 | 32,758.0 | 43,733.8 | 51,315.8 | 60,212.3 | 70,651.2 | 82,899.8 |
| Total Cash, percent | .0 | .0 | .0 | .0 | .0 | .0 | .0 | .0 | .0 | .0 |
| Account Receivables | 25,753.0 | 55,327.0 | 59,120.0 | 42,801.0 | 40,794.0 | 52,485.3 | 61,584.5 | 72,261.3 | 84,789.1 | 99,488.8 |
| Account Receivables, % | 21.51 | 29.97 | 22.45 | 19.55 | 20.85 | 22.87 | 22.87 | 22.87 | 22.87 | 22.87 |
| Inventories | 14,730.0 | 19,952.0 | 22,936.0 | 19,317.0 | 18,868.0 | 23,085.7 | 27,088.0 | 31,784.2 | 37,294.6 | 43,760.2 |
| Inventories, % | 12.31 | 10.81 | 8.71 | 8.82 | 9.65 | 10.06 | 10.06 | 10.06 | 10.06 | 10.06 |
| Accounts Payable | 23,574.0 | 36,837.0 | 41,346.0 | 41,335.0 | 39,932.0 | 43,444.3 | 50,976.1 | 59,813.7 | 70,183.5 | 82,351.1 |
| Accounts Payable, % | 19.69 | 19.95 | 15.7 | 18.88 | 20.41 | 18.93 | 18.93 | 18.93 | 18.93 | 18.93 |
| Capital Expenditure | -10,764.0 | -12,343.0 | -15,690.0 | -17,722.0 | -14,909.0 | -17,146.3 | -20,118.9 | -23,606.9 | -27,699.6 | -32,501.8 |
| Capital Expenditure, % | -8.99 | -6.69 | -5.96 | -8.09 | -7.62 | -7.47 | -7.47 | -7.47 | -7.47 | -7.47 |
| Tax Rate, % | 37.55 | 37.55 | 37.55 | 37.55 | 37.55 | 37.55 | 37.55 | 37.55 | 37.55 | 37.55 |
| EBITAT | -5,660.4 | 14,984.3 | 22,401.4 | 22,706.6 | 18,163.1 | 17,829.5 | 20,920.6 | 24,547.5 | 28,803.3 | 33,796.8 |
| Depreciation | ||||||||||
| Changes in Account Receivables | ||||||||||
| Changes in Inventories | ||||||||||
| Changes in Accounts Payable | ||||||||||
| Capital Expenditure | ||||||||||
| UFCF | -19,071.4 | -5,306.7 | 16,335.4 | 38,729.6 | 16,332.1 | 4,925.6 | 14,755.7 | 17,313.8 | 20,315.5 | 23,837.5 |
| WACC, % | 6.88 | 6.14 | 5.86 | 6.14 | 6.16 | 6.24 | 6.24 | 6.24 | 6.24 | 6.24 |
| PV UFCF | ||||||||||
| SUM PV UFCF | 65,713.8 | |||||||||
| Long Term Growth Rate, % | 2.00 | |||||||||
| Free cash flow (T + 1) | 24,314 | |||||||||
| Terminal Value | 573,849 | |||||||||
| Present Terminal Value | 424,050 | |||||||||
| Enterprise Value | 489,764 | |||||||||
| Net Debt | 27,713 | |||||||||
| Equity Value | 462,051 | |||||||||
| Diluted Shares Outstanding, MM | 2,355 | |||||||||
| Equity Value Per Share | 196.16 |
What You Will Get
- Editable Excel Template: A fully customizable Excel-based DCF Calculator featuring pre-filled real TotalEnergies SE (TTE) financials.
- Real-World Data: Historical data and forward-looking estimates (as indicated in the yellow cells).
- Forecast Flexibility: Adjust forecast assumptions such as revenue growth, EBITDA %, and WACC.
- Automatic Calculations: Instantly observe the effect of your inputs on TotalEnergies SE (TTE)’s valuation.
- Professional Tool: Designed for investors, CFOs, consultants, and financial analysts.
- User-Friendly Design: Organized for clarity and ease of use, complete with step-by-step instructions.
Key Features
- Comprehensive Data: TotalEnergies’ historical financial reports and pre-filled projections.
- Customizable Inputs: Adjust WACC, tax rates, revenue growth, and EBITDA margins as needed.
- Real-Time Results: View TotalEnergies’ intrinsic value recalculating instantly.
- Visual Insights: Dashboard graphs showcase valuation outcomes and essential metrics.
- Designed for Precision: A professional-grade tool for analysts, investors, and finance specialists.
How It Works
- Step 1: Download the Excel file.
- Step 2: Review pre-entered TotalEnergies SE (TTE) data (historical and projected).
- Step 3: Adjust key assumptions (yellow cells) based on your analysis.
- Step 4: View automatic recalculations for TotalEnergies SE’s intrinsic value.
- Step 5: Use the outputs for investment decisions or reporting.
Why Choose This Calculator for TotalEnergies SE (TTE)?
- User-Friendly Interface: Perfectly crafted for both novices and seasoned users.
- Customizable Inputs: Adjust parameters effortlessly to suit your financial analysis.
- Real-Time Feedback: Observe immediate updates to TotalEnergies' valuation as you tweak the inputs.
- Pre-Loaded Data: Comes with TotalEnergies' actual financial figures for swift evaluations.
- Relied Upon by Experts: Favored by investors and analysts for making well-informed choices.
Who Should Use TotalEnergies SE (TTE)?
- Investors: Make informed decisions with a comprehensive analysis of energy market trends.
- Energy Analysts: Streamline your research with detailed reports on TotalEnergies SE (TTE) performance.
- Consultants: Easily modify presentations and reports tailored to your clients' energy needs.
- Energy Enthusiasts: Enhance your knowledge of the energy sector through insightful case studies.
- Educators and Students: Utilize it as a valuable resource in energy-related academic programs.
What the Template Contains
- Operating and Balance Sheet Data: Pre-filled TotalEnergies SE (TTE) historical data and forecasts, including revenue, EBITDA, EBIT, and capital expenditures.
- WACC Calculation: A dedicated sheet for Weighted Average Cost of Capital (WACC), including parameters like Beta, risk-free rate, and share price.
- DCF Valuation (Unlevered and Levered): Editable Discounted Cash Flow models showing intrinsic value with detailed calculations.
- Financial Statements: Pre-loaded financial statements (annual and quarterly) to support analysis.
- Key Ratios: Includes profitability, leverage, and efficiency ratios for TotalEnergies SE (TTE).
- Dashboard and Charts: Visual summary of valuation outputs and assumptions to analyze results easily.
Disclaimer
All information, articles, and product details provided on this website are for general informational and educational purposes only. We do not claim any ownership over, nor do we intend to infringe upon, any trademarks, copyrights, logos, brand names, or other intellectual property mentioned or depicted on this site. Such intellectual property remains the property of its respective owners, and any references here are made solely for identification or informational purposes, without implying any affiliation, endorsement, or partnership.
We make no representations or warranties, express or implied, regarding the accuracy, completeness, or suitability of any content or products presented. Nothing on this website should be construed as legal, tax, investment, financial, medical, or other professional advice. In addition, no part of this site—including articles or product references—constitutes a solicitation, recommendation, endorsement, advertisement, or offer to buy or sell any securities, franchises, or other financial instruments, particularly in jurisdictions where such activity would be unlawful.
All content is of a general nature and may not address the specific circumstances of any individual or entity. It is not a substitute for professional advice or services. Any actions you take based on the information provided here are strictly at your own risk. You accept full responsibility for any decisions or outcomes arising from your use of this website and agree to release us from any liability in connection with your use of, or reliance upon, the content or products found herein.