
|
Wheels Up Experience Inc. (UP) Avaliação DCF |
Totalmente Editável: Adapte-Se Às Suas Necessidades No Excel Ou Planilhas
Design Profissional: Modelos Confiáveis E Padrão Da Indústria
Pré-Construídos Para Uso Rápido E Eficiente
Compatível com MAC/PC, totalmente desbloqueado
Não É Necessária Experiência; Fácil De Seguir
Wheels Up Experience Inc. (UP) Bundle
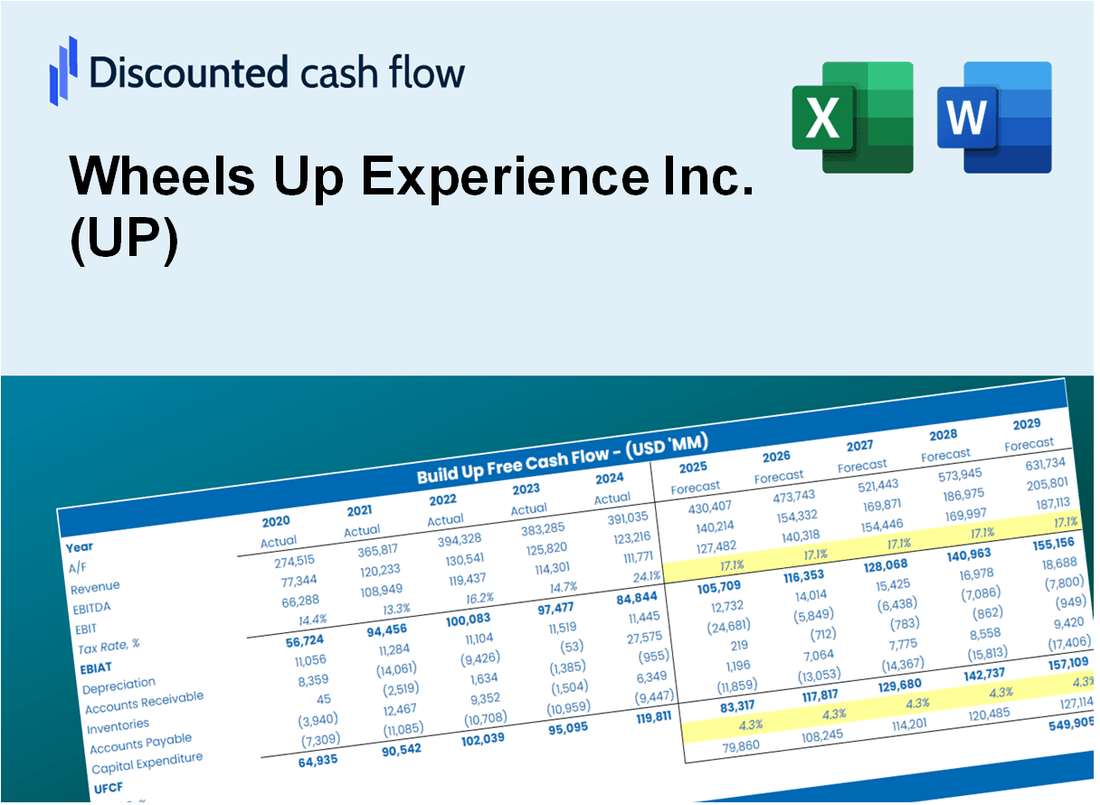
Obtenha insights sobre suas rodas Up Experience Inc. (UP) Análise de avaliação usando nossa calculadora DCF de ponta! Equipado com dados reais (UP), este modelo do Excel permite ajustar as previsões e suposições para calcular com precisão o valor intrínseco das rodas Experience Inc.
What You Will Get
- Editable Excel Template: A fully customizable Excel-based DCF Calculator featuring pre-filled real Wheels Up Experience Inc. (UP) financials.
- Real-World Data: Historical data and forward-looking estimates (as indicated in the highlighted cells).
- Forecast Flexibility: Adjust forecast assumptions such as revenue growth, EBITDA %, and WACC.
- Automatic Calculations: Instantly observe the effects of your inputs on Wheels Up’s valuation.
- Professional Tool: Designed for investors, CFOs, consultants, and financial analysts.
- User-Friendly Design: Organized for clarity and ease of use, complete with step-by-step instructions.
Key Features
- Real-Time Wheels Up Data: Pre-filled with Wheels Up Experience Inc.'s historical performance and future projections.
- Fully Customizable Inputs: Modify flight hours, pricing strategies, operational costs, and growth rates.
- Dynamic Valuation Model: Instant updates to Net Present Value (NPV) and intrinsic value based on your adjustments.
- Scenario Testing: Develop various forecasting scenarios to evaluate different valuation results.
- User-Friendly Design: Intuitive, organized, and suitable for both industry experts and newcomers.
How It Works
- 1. Access the Template: Download and open the Excel file containing Wheels Up Experience Inc.'s (UP) preloaded data.
- 2. Modify Assumptions: Adjust key variables such as growth rates, WACC, and capital expenditures as needed.
- 3. Analyze Results Instantly: The DCF model will automatically compute the intrinsic value and NPV.
- 4. Explore Scenarios: Evaluate various forecasts to assess different valuation results.
- 5. Present with Assurance: Deliver professional valuation insights to inform your decision-making.
Why Choose This Calculator for Wheels Up Experience Inc. (UP)?
- Accurate Data: Real Wheels Up financials provide dependable valuation outcomes.
- Customizable: Modify essential parameters such as growth rates, WACC, and tax rates to align with your forecasts.
- Time-Saving: Pre-configured calculations save you from starting from scratch.
- Professional-Grade Tool: Tailored for investors, analysts, and consultants in the aviation sector.
- User-Friendly: Intuitive design and step-by-step guidance ensure ease of use for everyone.
Who Should Use This Product?
- Aviation Enthusiasts: Discover the intricacies of private aviation and how to leverage them using real-time data.
- Travel Professionals: Integrate advanced flight solutions into your travel planning or consultancy services.
- Investors: Evaluate your strategies and assess the market performance of Wheels Up Experience Inc. (UP).
- Analysts: Enhance your analysis with a comprehensive, customizable flight service model.
- Corporate Executives: Understand how private aviation services can optimize business travel for large organizations.
What the Template Contains
- Pre-Filled DCF Model: Wheels Up Experience Inc.'s (UP) financial data preloaded for immediate use.
- WACC Calculator: Detailed calculations for Weighted Average Cost of Capital specific to Wheels Up Experience Inc. (UP).
- Financial Ratios: Assess Wheels Up Experience Inc.'s (UP) profitability, leverage, and efficiency metrics.
- Editable Inputs: Modify assumptions such as growth rates, profit margins, and CAPEX to tailor your analysis.
- Financial Statements: Access to annual and quarterly reports for comprehensive evaluation.
- Interactive Dashboard: Effortlessly visualize key valuation metrics and outcomes for Wheels Up Experience Inc. (UP).
Disclaimer
All information, articles, and product details provided on this website are for general informational and educational purposes only. We do not claim any ownership over, nor do we intend to infringe upon, any trademarks, copyrights, logos, brand names, or other intellectual property mentioned or depicted on this site. Such intellectual property remains the property of its respective owners, and any references here are made solely for identification or informational purposes, without implying any affiliation, endorsement, or partnership.
We make no representations or warranties, express or implied, regarding the accuracy, completeness, or suitability of any content or products presented. Nothing on this website should be construed as legal, tax, investment, financial, medical, or other professional advice. In addition, no part of this site—including articles or product references—constitutes a solicitation, recommendation, endorsement, advertisement, or offer to buy or sell any securities, franchises, or other financial instruments, particularly in jurisdictions where such activity would be unlawful.
All content is of a general nature and may not address the specific circumstances of any individual or entity. It is not a substitute for professional advice or services. Any actions you take based on the information provided here are strictly at your own risk. You accept full responsibility for any decisions or outcomes arising from your use of this website and agree to release us from any liability in connection with your use of, or reliance upon, the content or products found herein.