
|
Valor Line, Inc. (Valu) Avaliação DCF |
Totalmente Editável: Adapte-Se Às Suas Necessidades No Excel Ou Planilhas
Design Profissional: Modelos Confiáveis E Padrão Da Indústria
Pré-Construídos Para Uso Rápido E Eficiente
Compatível com MAC/PC, totalmente desbloqueado
Não É Necessária Experiência; Fácil De Seguir
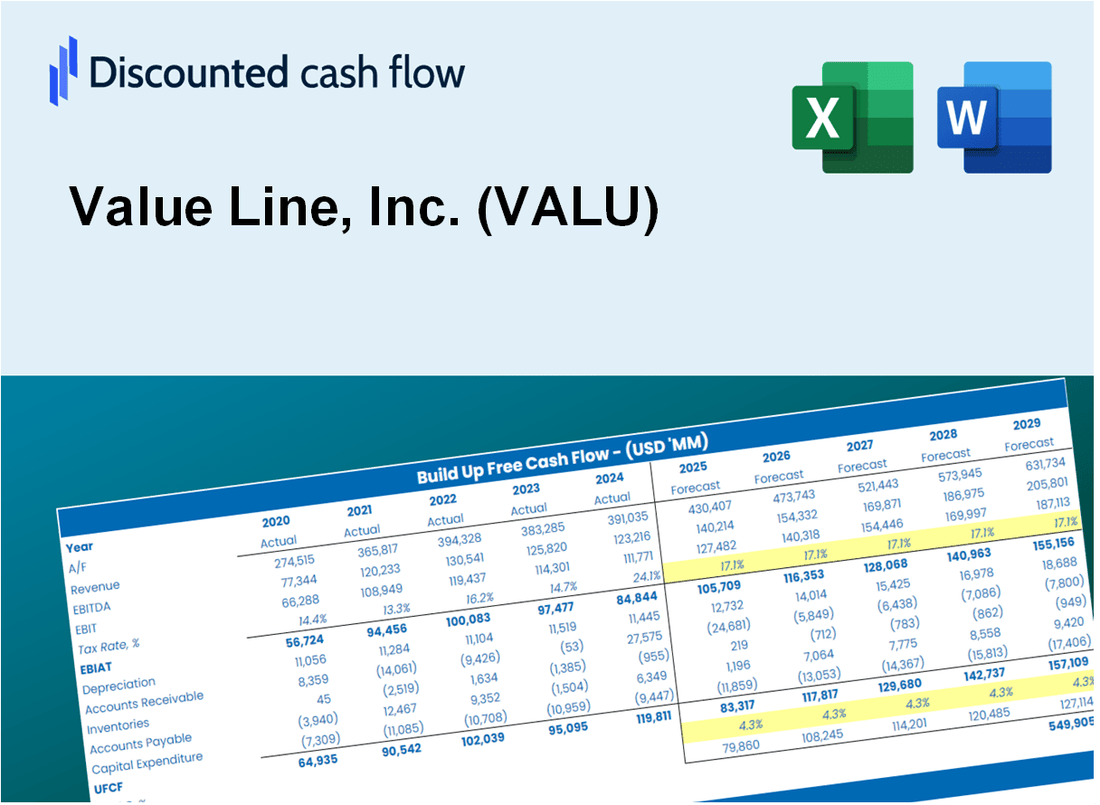
Value Line, Inc. (VALU) Bundle
Avalie as perspectivas financeiras da Value Line, Inc. (VALU) como um especialista! Esta calculadora DCF (VALU) oferece dados financeiros pré-preenchidos e flexibilidade para modificar o crescimento da receita, o WACC, as margens e outras suposições essenciais para se alinhar às suas projeções.
Discounted Cash Flow (DCF) - (USD MM)
| Year | AY1 2021 |
AY2 2022 |
AY3 2023 |
AY4 2024 |
AY5 2025 |
FY1 2026 |
FY2 2027 |
FY3 2028 |
FY4 2029 |
FY5 2030 |
|---|---|---|---|---|---|---|---|---|---|---|
| Revenue | 40.4 | 40.5 | 39.7 | 37.5 | 35.1 | 33.9 | 32.7 | 31.6 | 30.5 | 29.5 |
| Revenue Growth, % | 0 | 0.32927 | -2.05 | -5.56 | -6.42 | -3.43 | -3.43 | -3.43 | -3.43 | -3.43 |
| EBITDA | 8.8 | 12.1 | 12.8 | 10.6 | 7.3 | 9.0 | 8.7 | 8.4 | 8.1 | 7.8 |
| EBITDA, % | 21.86 | 29.95 | 32.29 | 28.14 | 20.68 | 26.58 | 26.58 | 26.58 | 26.58 | 26.58 |
| Depreciation | 1.3 | 1.3 | 1.3 | 1.4 | 1.3 | 1.2 | 1.1 | 1.1 | 1.1 | 1.0 |
| Depreciation, % | 3.2 | 3.3 | 3.4 | 3.76 | 3.62 | 3.46 | 3.46 | 3.46 | 3.46 | 3.46 |
| EBIT | 7.5 | 10.8 | 11.5 | 9.1 | 6.0 | 7.8 | 7.6 | 7.3 | 7.1 | 6.8 |
| EBIT, % | 18.65 | 26.65 | 28.9 | 24.38 | 17.06 | 23.13 | 23.13 | 23.13 | 23.13 | 23.13 |
| Total Cash | 45.4 | 57.8 | 62.1 | 68.3 | 77.4 | 33.9 | 32.7 | 31.6 | 30.5 | 29.5 |
| Total Cash, percent | .0 | .0 | .0 | .0 | .0 | .0 | .0 | .0 | .0 | .0 |
| Account Receivables | 4.0 | 1.7 | 2.1 | 1.3 | 1.3 | 1.8 | 1.7 | 1.7 | 1.6 | 1.6 |
| Account Receivables, % | 9.87 | 4.14 | 5.35 | 3.49 | 3.78 | 5.33 | 5.33 | 5.33 | 5.33 | 5.33 |
| Inventories | .0 | .0 | .0 | .0 | .0 | .0 | .0 | .0 | .0 | .0 |
| Inventories, % | 0 | 0 | 0 | 0 | 0 | 0 | 0 | 0 | 0 | 0 |
| Accounts Payable | 2.1 | 1.3 | 1.3 | 1.4 | 1.5 | 1.3 | 1.3 | 1.2 | 1.2 | 1.2 |
| Accounts Payable, % | 5.14 | 3.24 | 3.18 | 3.81 | 4.36 | 3.95 | 3.95 | 3.95 | 3.95 | 3.95 |
| Capital Expenditure | -.2 | .0 | -.1 | -.1 | -.2 | -.1 | -.1 | -.1 | -.1 | -.1 |
| Capital Expenditure, % | -0.44068 | -0.02714374 | -0.35269 | -0.2054 | -0.50743 | -0.30667 | -0.30667 | -0.30667 | -0.30667 | -0.30667 |
| Tax Rate, % | 24.89 | 24.89 | 24.89 | 24.89 | 24.89 | 24.89 | 24.89 | 24.89 | 24.89 | 24.89 |
| EBITAT | 5.8 | 8.4 | 8.7 | 6.9 | 4.5 | 6.0 | 5.8 | 5.6 | 5.4 | 5.2 |
| Depreciation | ||||||||||
| Changes in Account Receivables | ||||||||||
| Changes in Inventories | ||||||||||
| Changes in Accounts Payable | ||||||||||
| Capital Expenditure | ||||||||||
| UFCF | 5.0 | 11.3 | 9.4 | 9.2 | 5.7 | 6.4 | 6.8 | 6.6 | 6.4 | 6.1 |
| WACC, % | 9.56 | 9.56 | 9.56 | 9.56 | 9.56 | 9.56 | 9.56 | 9.56 | 9.56 | 9.56 |
| PV UFCF | ||||||||||
| SUM PV UFCF | 24.8 | |||||||||
| Long Term Growth Rate, % | 2.00 | |||||||||
| Free cash flow (T + 1) | 6 | |||||||||
| Terminal Value | 83 | |||||||||
| Present Terminal Value | 52 | |||||||||
| Enterprise Value | 77 | |||||||||
| Net Debt | -30 | |||||||||
| Equity Value | 108 | |||||||||
| Diluted Shares Outstanding, MM | 9 | |||||||||
| Equity Value Per Share | 11.44 |
What You Will Receive
- Adjustable Input Parameters: Seamlessly modify key factors (growth %, profit margins, discount rate) to explore various scenarios.
- Comprehensive Market Data: Value Line’s financial metrics pre-loaded to facilitate your evaluation.
- Instant DCF Calculations: The model automatically computes Net Present Value (NPV) and intrinsic value for your convenience.
- Tailored and Professional Design: A refined Excel template that meets your valuation requirements.
- Engineered for Analysts and Investors: Perfect for assessing forecasts, confirming strategies, and enhancing efficiency.
Key Features
- Comprehensive Financial Data: Gain access to reliable historical figures and forward-looking estimates for Value Line, Inc. (VALU).
- Adjustable Analysis Parameters: Modify highlighted fields such as discount rates, growth metrics, and profit margins.
- Real-Time Calculations: Automatic updates for discounted cash flow (DCF), Net Present Value (NPV), and cash flow assessments.
- User-Friendly Dashboard: Intuitive charts and summaries designed to help you interpret your valuation findings.
- Designed for All Skill Levels: A straightforward layout suitable for investors, financial officers, and consultants alike.
How It Works
- Download the Template: Gain immediate access to the Excel-based VALU DCF Calculator.
- Input Your Assumptions: Modify the yellow-highlighted cells for growth rates, WACC, margins, and more.
- Instant Calculations: The model automatically recalculates Value Line, Inc.'s intrinsic value.
- Test Scenarios: Experiment with different assumptions to assess potential valuation shifts.
- Analyze and Decide: Utilize the results to inform your investment or financial analysis.
Why Choose Value Line, Inc. (VALU)?
- Save Time: Instantly access comprehensive research without the hassle of manual analysis.
- Enhance Accuracy: Dependable data and insights minimize the risk of valuation errors.
- Fully Customizable: Adjust reports to align with your specific investment strategies and objectives.
- Easy to Understand: Intuitive graphs and summaries simplify complex information for better decision-making.
- Backed by Professionals: Developed for investors who prioritize accuracy and efficiency in their evaluations.
Who Should Use Value Line, Inc. (VALU)?
- Investors: Evaluate Value Line, Inc.'s (VALU) financial performance before making investment decisions.
- CFOs and Financial Analysts: Enhance valuation methodologies and validate financial forecasts.
- Startup Founders: Discover how established firms like Value Line, Inc. (VALU) are appraised in the market.
- Consultants: Provide clients with expert valuation insights and reports on Value Line, Inc. (VALU).
- Students and Educators: Utilize real-world examples from Value Line, Inc. (VALU) to teach and learn valuation principles.
What the Template Contains
- Pre-Filled DCF Model: Value Line, Inc.'s (VALU) financial data preloaded for immediate use.
- WACC Calculator: Detailed calculations for Weighted Average Cost of Capital specific to Value Line, Inc. (VALU).
- Financial Ratios: Evaluate Value Line, Inc.'s (VALU) profitability, leverage, and efficiency.
- Editable Inputs: Change assumptions such as growth, margins, and CAPEX to fit your scenarios for Value Line, Inc. (VALU).
- Financial Statements: Annual and quarterly reports to support detailed analysis of Value Line, Inc. (VALU).
- Interactive Dashboard: Easily visualize key valuation metrics and results for Value Line, Inc. (VALU).
Disclaimer
All information, articles, and product details provided on this website are for general informational and educational purposes only. We do not claim any ownership over, nor do we intend to infringe upon, any trademarks, copyrights, logos, brand names, or other intellectual property mentioned or depicted on this site. Such intellectual property remains the property of its respective owners, and any references here are made solely for identification or informational purposes, without implying any affiliation, endorsement, or partnership.
We make no representations or warranties, express or implied, regarding the accuracy, completeness, or suitability of any content or products presented. Nothing on this website should be construed as legal, tax, investment, financial, medical, or other professional advice. In addition, no part of this site—including articles or product references—constitutes a solicitation, recommendation, endorsement, advertisement, or offer to buy or sell any securities, franchises, or other financial instruments, particularly in jurisdictions where such activity would be unlawful.
All content is of a general nature and may not address the specific circumstances of any individual or entity. It is not a substitute for professional advice or services. Any actions you take based on the information provided here are strictly at your own risk. You accept full responsibility for any decisions or outcomes arising from your use of this website and agree to release us from any liability in connection with your use of, or reliance upon, the content or products found herein.