
|
VEEVA SYSTEMS INC. (VEEV) Avaliação DCF |
Totalmente Editável: Adapte-Se Às Suas Necessidades No Excel Ou Planilhas
Design Profissional: Modelos Confiáveis E Padrão Da Indústria
Pré-Construídos Para Uso Rápido E Eficiente
Compatível com MAC/PC, totalmente desbloqueado
Não É Necessária Experiência; Fácil De Seguir
Veeva Systems Inc. (VEEV) Bundle
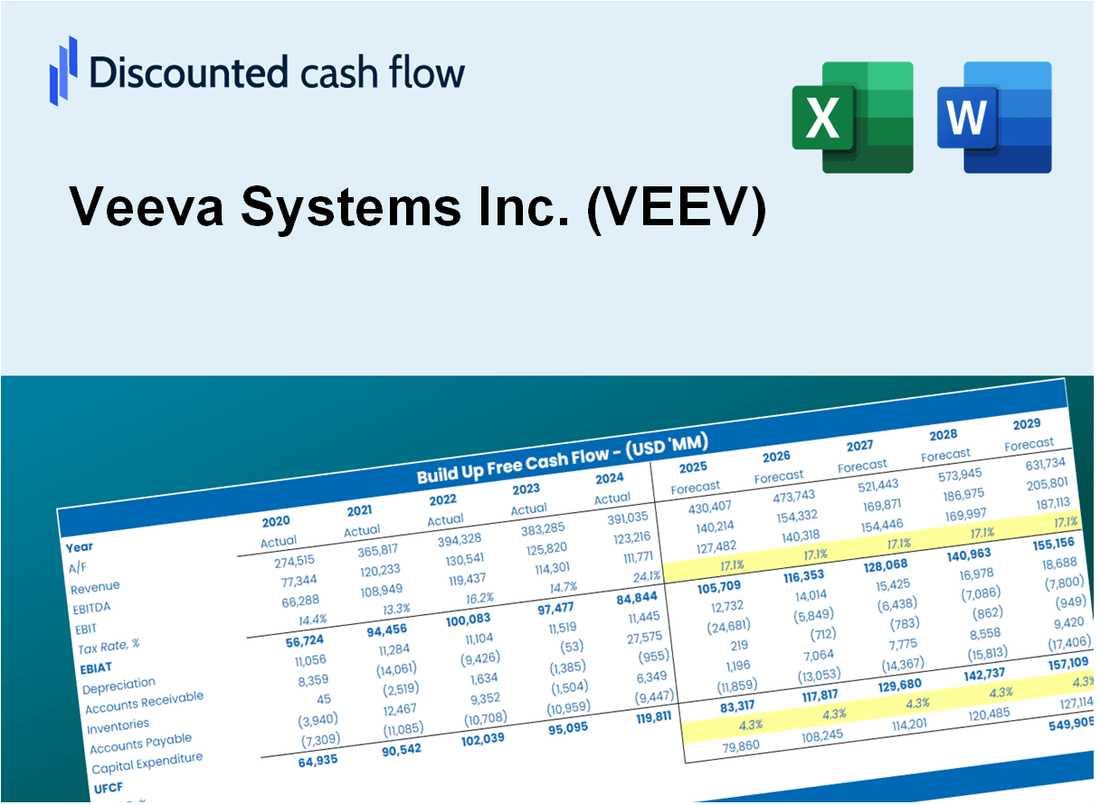
Projetado para precisão, nossa calculadora VEEV DCF permite avaliar a avaliação da Veeva Systems Inc. usando dados financeiros do mundo real, fornecendo flexibilidade completa para modificar todos os parâmetros essenciais para melhorar as projeções.
What You Will Get
- Real VEEV Financial Data: Pre-filled with Veeva Systems’ historical and projected data for precise analysis.
- Fully Editable Template: Modify key inputs like revenue growth, WACC, and EBITDA % with ease.
- Automatic Calculations: See Veeva Systems’ intrinsic value update instantly based on your changes.
- Professional Valuation Tool: Designed for investors, analysts, and consultants seeking accurate DCF results.
- User-Friendly Design: Simple structure and clear instructions for all experience levels.
Key Features
- Customizable Revenue Inputs: Adjust essential metrics such as subscription growth, operating margins, and R&D expenses.
- Instant DCF Valuation: Quickly computes intrinsic value, net present value (NPV), and other key financial metrics.
- High-Precision Accuracy: Incorporates Veeva's actual financial data for dependable valuation results.
- Effortless Scenario Testing: Easily explore various assumptions and analyze the resulting impacts.
- Efficiency Booster: Streamline your workflow by avoiding the creation of intricate valuation models from the ground up.
How It Works
- 1. Access the Template: Download and open the Excel file featuring Veeva Systems Inc.'s (VEEV) preloaded data.
- 2. Adjust Key Inputs: Modify essential parameters such as growth rates, WACC, and capital expenditures.
- 3. View Results in Real-Time: The DCF model automatically computes intrinsic value and NPV based on your inputs.
- 4. Explore Different Scenarios: Analyze various forecasts to evaluate diverse valuation outcomes.
- 5. Present with Assurance: Deliver professional valuation insights to enhance your decision-making process.
Why Choose Veeva Systems Inc. (VEEV) Calculator?
- All-in-One Solution: Combines DCF, WACC, and financial ratio assessments for comprehensive analysis.
- Flexible Inputs: Modify the highlighted fields to explore different financial scenarios.
- In-Depth Analysis: Automatically determines Veeva's intrinsic value and Net Present Value.
- Data-Rich Framework: Features historical and projected data for reliable analysis foundations.
- High-Quality Standards: Perfect for financial analysts, investors, and business advisors.
Who Should Use This Product?
- Investors: Evaluate Veeva Systems' valuation prior to making stock transactions.
- CFOs and Financial Analysts: Optimize valuation methodologies and assess financial forecasts.
- Startup Founders: Discover how leading public companies like Veeva Systems are valued.
- Consultants: Provide comprehensive valuation reports for their clients.
- Students and Educators: Utilize real market data to learn and teach valuation strategies.
What the Template Contains
- Comprehensive DCF Model: Editable template with detailed valuation calculations for Veeva Systems Inc. (VEEV).
- Real-World Data: Veeva’s historical and projected financials preloaded for analysis.
- Customizable Parameters: Adjust WACC, growth rates, and tax assumptions to test various scenarios.
- Financial Statements: Complete annual and quarterly breakdowns for deeper insights into Veeva's performance.
- Key Ratios: Built-in analysis for profitability, efficiency, and leverage specific to Veeva Systems Inc. (VEEV).
- Dashboard with Visual Outputs: Charts and tables providing clear, actionable results for informed decision-making.
Disclaimer
All information, articles, and product details provided on this website are for general informational and educational purposes only. We do not claim any ownership over, nor do we intend to infringe upon, any trademarks, copyrights, logos, brand names, or other intellectual property mentioned or depicted on this site. Such intellectual property remains the property of its respective owners, and any references here are made solely for identification or informational purposes, without implying any affiliation, endorsement, or partnership.
We make no representations or warranties, express or implied, regarding the accuracy, completeness, or suitability of any content or products presented. Nothing on this website should be construed as legal, tax, investment, financial, medical, or other professional advice. In addition, no part of this site—including articles or product references—constitutes a solicitation, recommendation, endorsement, advertisement, or offer to buy or sell any securities, franchises, or other financial instruments, particularly in jurisdictions where such activity would be unlawful.
All content is of a general nature and may not address the specific circumstances of any individual or entity. It is not a substitute for professional advice or services. Any actions you take based on the information provided here are strictly at your own risk. You accept full responsibility for any decisions or outcomes arising from your use of this website and agree to release us from any liability in connection with your use of, or reliance upon, the content or products found herein.