
|
Avaliação DCF VEON LTD. (VEON) |
Totalmente Editável: Adapte-Se Às Suas Necessidades No Excel Ou Planilhas
Design Profissional: Modelos Confiáveis E Padrão Da Indústria
Pré-Construídos Para Uso Rápido E Eficiente
Compatível com MAC/PC, totalmente desbloqueado
Não É Necessária Experiência; Fácil De Seguir
VEON Ltd. (VEON) Bundle
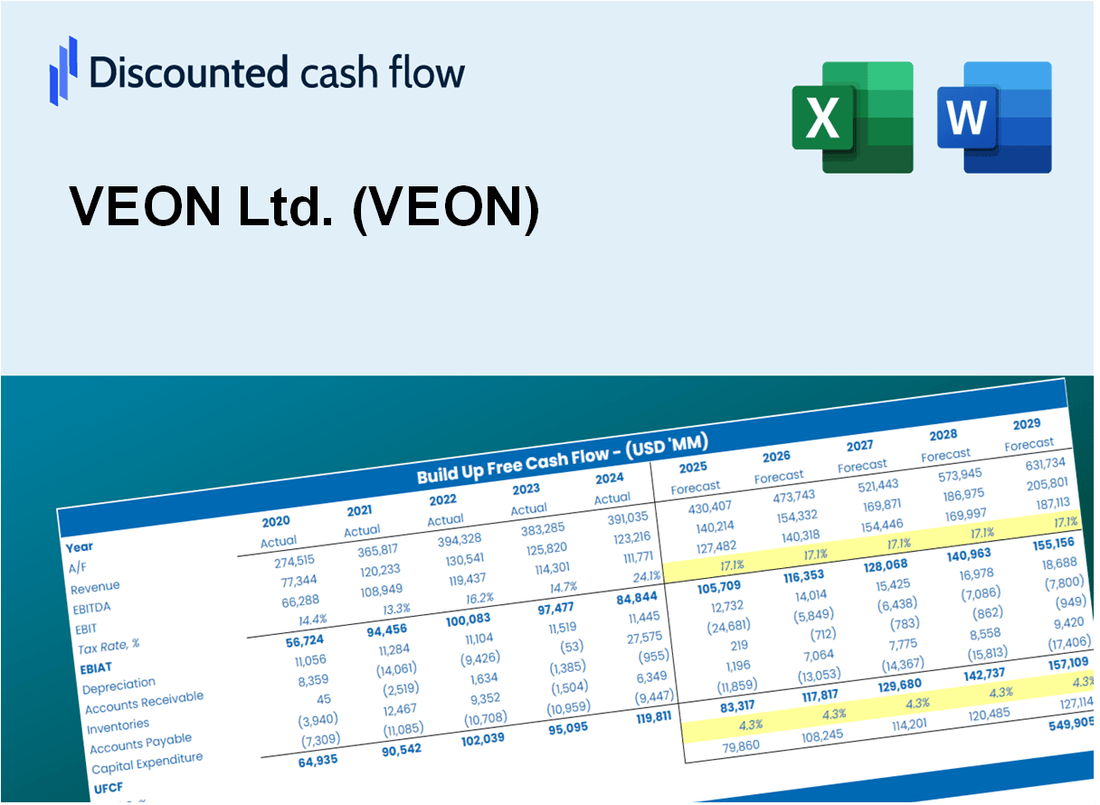
Seja você um investidor ou analista, esta calculadora DCF (VEON) é o seu recurso preferido para uma avaliação precisa. Equipado com dados reais da VEON LTD., você pode ajustar as previsões e observar os efeitos em tempo real.
Discounted Cash Flow (DCF) - (USD MM)
| Year | AY1 2020 |
AY2 2021 |
AY3 2022 |
AY4 2023 |
AY5 2024 |
FY1 2025 |
FY2 2026 |
FY3 2027 |
FY4 2028 |
FY5 2029 |
|---|---|---|---|---|---|---|---|---|---|---|
| Revenue | 3,482.0 | 3,850.0 | 3,755.0 | 3,698.0 | 4,004.0 | 4,152.7 | 4,307.0 | 4,467.0 | 4,632.9 | 4,805.0 |
| Revenue Growth, % | 0 | 10.57 | -2.47 | -1.52 | 8.27 | 3.71 | 3.71 | 3.71 | 3.71 | 3.71 |
| EBITDA | 1,734.0 | 1,840.0 | 1,640.0 | 1,393.0 | 1,476.0 | 1,792.3 | 1,858.9 | 1,927.9 | 1,999.5 | 2,073.8 |
| EBITDA, % | 49.8 | 47.79 | 43.68 | 37.67 | 36.86 | 43.16 | 43.16 | 43.16 | 43.16 | 43.16 |
| Depreciation | 792.0 | 799.0 | 671.0 | 516.0 | 513.0 | 732.0 | 759.2 | 787.4 | 816.6 | 847.0 |
| Depreciation, % | 22.75 | 20.75 | 17.87 | 13.95 | 12.81 | 17.63 | 17.63 | 17.63 | 17.63 | 17.63 |
| EBIT | 942.0 | 1,041.0 | 969.0 | 877.0 | 963.0 | 1,060.3 | 1,099.7 | 1,140.5 | 1,182.9 | 1,226.8 |
| EBIT, % | 27.05 | 27.04 | 25.81 | 23.72 | 24.05 | 25.53 | 25.53 | 25.53 | 25.53 | 25.53 |
| Total Cash | 1,759.0 | 2,338.0 | 3,227.0 | 2,335.0 | 2,046.0 | 2,586.5 | 2,682.6 | 2,782.2 | 2,885.6 | 2,992.8 |
| Total Cash, percent | .0 | .0 | .0 | .0 | .0 | .0 | .0 | .0 | .0 | .0 |
| Account Receivables | 804.0 | 920.0 | 577.0 | 645.0 | 572.0 | 781.4 | 810.4 | 840.5 | 871.7 | 904.1 |
| Account Receivables, % | 23.09 | 23.9 | 15.37 | 17.44 | 14.29 | 18.82 | 18.82 | 18.82 | 18.82 | 18.82 |
| Inventories | 111.0 | 111.0 | 73.0 | 23.0 | 15.0 | 74.8 | 77.6 | 80.5 | 83.5 | 86.6 |
| Inventories, % | 3.19 | 2.88 | 1.94 | 0.62196 | 0.37463 | 1.8 | 1.8 | 1.8 | 1.8 | 1.8 |
| Accounts Payable | 1,946.0 | 2,031.0 | 1,087.0 | 1,200.0 | 1,276.0 | 1,676.9 | 1,739.2 | 1,803.8 | 1,870.8 | 1,940.3 |
| Accounts Payable, % | 55.89 | 52.75 | 28.95 | 32.45 | 31.87 | 40.38 | 40.38 | 40.38 | 40.38 | 40.38 |
| Capital Expenditure | -1,677.0 | -699.0 | -634.0 | -531.0 | -627.0 | -940.3 | -975.3 | -1,011.5 | -1,049.1 | -1,088.0 |
| Capital Expenditure, % | -48.16 | -18.16 | -16.88 | -14.36 | -15.66 | -22.64 | -22.64 | -22.64 | -22.64 | -22.64 |
| Tax Rate, % | 41.05 | 41.05 | 41.05 | 41.05 | 41.05 | 41.05 | 41.05 | 41.05 | 41.05 | 41.05 |
| EBITAT | -881.4 | 1,512.1 | -195.7 | -3,966.1 | 567.7 | 337.1 | 349.6 | 362.6 | 376.0 | 390.0 |
| Depreciation | ||||||||||
| Changes in Account Receivables | ||||||||||
| Changes in Inventories | ||||||||||
| Changes in Accounts Payable | ||||||||||
| Capital Expenditure | ||||||||||
| UFCF | -735.4 | 1,581.1 | -721.7 | -3,886.1 | 610.7 | 260.4 | 164.0 | 170.1 | 176.4 | 182.9 |
| WACC, % | 0.34262 | 10.56 | 0.34262 | 0.34262 | 6.37 | 3.59 | 3.59 | 3.59 | 3.59 | 3.59 |
| PV UFCF | ||||||||||
| SUM PV UFCF | 863.7 | |||||||||
| Long Term Growth Rate, % | 2.00 | |||||||||
| Free cash flow (T + 1) | 187 | |||||||||
| Terminal Value | 11,730 | |||||||||
| Present Terminal Value | 9,833 | |||||||||
| Enterprise Value | 10,697 | |||||||||
| Net Debt | 3,005 | |||||||||
| Equity Value | 7,692 | |||||||||
| Diluted Shares Outstanding, MM | 3 | |||||||||
| Equity Value Per Share | 2,654.51 |
What You Will Get
- Real VEON Data: Preloaded financials – from revenue to EBIT – based on actual and projected figures.
- Full Customization: Adjust all critical parameters (yellow cells) like WACC, growth %, and tax rates.
- Instant Valuation Updates: Automatic recalculations to analyze the impact of changes on VEON’s fair value.
- Versatile Excel Template: Tailored for quick edits, scenario testing, and detailed projections.
- Time-Saving and Accurate: Skip building models from scratch while maintaining precision and flexibility.
Key Features
- Comprehensive VEON Financials: Gain access to precise pre-loaded historical data and future forecasts.
- Adjustable Forecast Parameters: Modify the highlighted cells such as WACC, growth rates, and profit margins.
- Real-Time Calculations: Automatic updates for DCF, Net Present Value (NPV), and cash flow assessments.
- User-Friendly Dashboard: Intuitive charts and summaries to help you visualize your valuation outcomes.
- Designed for All Experience Levels: A straightforward, user-friendly layout tailored for investors, CFOs, and consultants.
How It Works
- Step 1: Download the prebuilt Excel template with VEON Ltd.’s (VEON) data included.
- Step 2: Explore the pre-filled sheets and familiarize yourself with the key metrics.
- Step 3: Update forecasts and assumptions in the editable yellow cells (WACC, growth, margins).
- Step 4: Instantly view recalculated results, including VEON Ltd.’s (VEON) intrinsic value.
- Step 5: Make informed investment decisions or generate reports using the outputs.
Why Choose VEON Ltd. (VEON)?
- Save Time: Quickly access comprehensive analytics without the hassle of building from the ground up.
- Enhance Accuracy: Utilize dependable data and methodologies to minimize valuation errors.
- Fully Customizable: Adjust the tools to align with your specific assumptions and forecasts.
- Easy to Understand: Intuitive visuals and outputs simplify the analysis of results.
- Endorsed by Professionals: Created for industry experts who prioritize both accuracy and functionality.
Who Should Use This Product?
- Investors: Accurately assess VEON’s fair value before making investment choices.
- CFOs: Utilize a professional-grade DCF model for VEON’s financial reporting and analysis.
- Consultants: Efficiently customize the template for valuation reports tailored to VEON clients.
- Entrepreneurs: Acquire insights into financial modeling practices employed by leading telecom companies.
- Educators: Implement it as a teaching resource to illustrate valuation techniques.
What the Template Contains
- Preloaded VEON Data: Historical and projected financial data, including revenue, EBIT, and capital expenditures.
- DCF and WACC Models: Professional-grade sheets for calculating intrinsic value and Weighted Average Cost of Capital.
- Editable Inputs: Yellow-highlighted cells for adjusting revenue growth, tax rates, and discount rates.
- Financial Statements: Comprehensive annual and quarterly financials for deeper analysis.
- Key Ratios: Profitability, leverage, and efficiency ratios to evaluate performance.
- Dashboard and Charts: Visual summaries of valuation outcomes and assumptions.
Disclaimer
All information, articles, and product details provided on this website are for general informational and educational purposes only. We do not claim any ownership over, nor do we intend to infringe upon, any trademarks, copyrights, logos, brand names, or other intellectual property mentioned or depicted on this site. Such intellectual property remains the property of its respective owners, and any references here are made solely for identification or informational purposes, without implying any affiliation, endorsement, or partnership.
We make no representations or warranties, express or implied, regarding the accuracy, completeness, or suitability of any content or products presented. Nothing on this website should be construed as legal, tax, investment, financial, medical, or other professional advice. In addition, no part of this site—including articles or product references—constitutes a solicitation, recommendation, endorsement, advertisement, or offer to buy or sell any securities, franchises, or other financial instruments, particularly in jurisdictions where such activity would be unlawful.
All content is of a general nature and may not address the specific circumstances of any individual or entity. It is not a substitute for professional advice or services. Any actions you take based on the information provided here are strictly at your own risk. You accept full responsibility for any decisions or outcomes arising from your use of this website and agree to release us from any liability in connection with your use of, or reliance upon, the content or products found herein.