
|
Viasat, Inc. (VSAT) Avaliação DCF |
Totalmente Editável: Adapte-Se Às Suas Necessidades No Excel Ou Planilhas
Design Profissional: Modelos Confiáveis E Padrão Da Indústria
Pré-Construídos Para Uso Rápido E Eficiente
Compatível com MAC/PC, totalmente desbloqueado
Não É Necessária Experiência; Fácil De Seguir
Viasat, Inc. (VSAT) Bundle
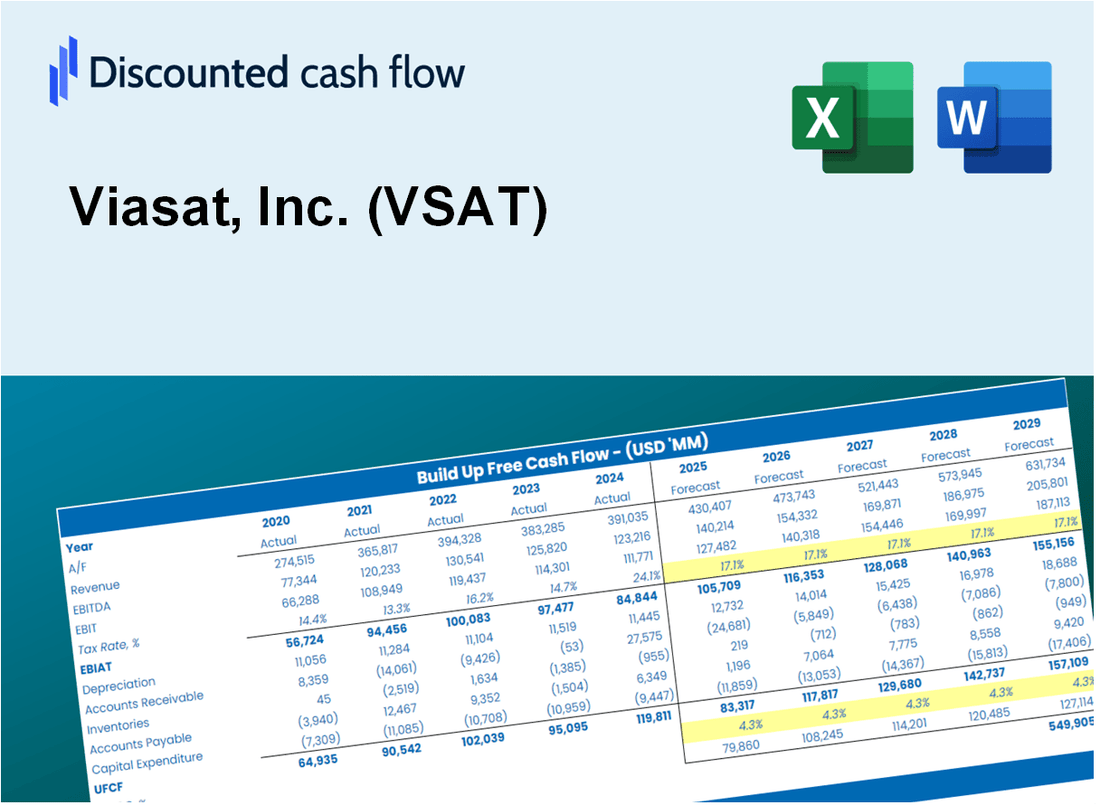
Avalie as perspectivas financeiras da Viasat, Inc. (VSAT), como um especialista experiente! Essa calculadora DCF (VSAT) fornece dados financeiros pré-preenchidos e a flexibilidade para modificar o crescimento da receita, o WACC, as margens e outras suposições cruciais para se alinhar com suas previsões.
What You Will Get
- Real VSAT Financial Data: Pre-filled with Viasat’s historical and projected data for precise analysis.
- Fully Editable Template: Modify key inputs like revenue growth, WACC, and EBITDA % with ease.
- Automatic Calculations: See Viasat’s intrinsic value update instantly based on your changes.
- Professional Valuation Tool: Designed for investors, analysts, and consultants seeking accurate DCF results.
- User-Friendly Design: Simple structure and clear instructions for all experience levels.
Key Features
- Customizable Forecast Inputs: Adjust essential factors such as revenue growth, EBITDA %, and capital expenditures.
- Instant DCF Valuation: Quickly computes intrinsic value, NPV, and other financial metrics.
- High-Precision Accuracy: Leverages Viasat’s real-world financial data for dependable valuation results.
- Effortless Scenario Analysis: Easily evaluate various assumptions and analyze results side by side.
- Efficiency Booster: Streamline the valuation process without the hassle of creating intricate models from the ground up.
How It Works
- Step 1: Download the Excel file.
- Step 2: Review pre-entered Viasat, Inc. (VSAT) data (historical and projected).
- Step 3: Adjust key assumptions (yellow cells) based on your analysis.
- Step 4: View automatic recalculations for Viasat, Inc. (VSAT)’s intrinsic value.
- Step 5: Use the outputs for investment decisions or reporting.
Why Choose Viasat, Inc. (VSAT)?
- Save Time: Instantly access comprehensive satellite communication solutions without starting from scratch.
- Enhance Connectivity: Reliable technology ensures consistent and high-quality internet services.
- Fully Customizable: Adapt services to meet specific needs and requirements of your business.
- User-Friendly Interface: Intuitive design makes it easy to navigate and manage your connectivity options.
- Backed by Expertise: Trusted by industry leaders for innovative solutions and exceptional customer support.
Who Should Use Viasat, Inc. (VSAT)?
- Investors: Gain insights and make informed decisions with Viasat's innovative communication solutions.
- Telecommunications Analysts: Streamline your analysis with comprehensive data on satellite technology and market trends.
- Consultants: Easily modify presentations or reports to highlight Viasat's competitive advantages in the industry.
- Technology Enthusiasts: Enhance your knowledge of satellite communications through Viasat's cutting-edge advancements.
- Educators and Students: Utilize Viasat's resources as a hands-on learning tool in technology and telecommunications courses.
What the Template Contains
- Operating and Balance Sheet Data: Pre-filled Viasat, Inc. (VSAT) historical data and forecasts, including revenue, EBITDA, EBIT, and capital expenditures.
- WACC Calculation: A dedicated sheet for Weighted Average Cost of Capital (WACC), featuring parameters such as Beta, risk-free rate, and share price.
- DCF Valuation (Unlevered and Levered): Editable Discounted Cash Flow models displaying intrinsic value with comprehensive calculations.
- Financial Statements: Pre-loaded financial statements (annual and quarterly) to facilitate analysis.
- Key Ratios: Incorporates profitability, leverage, and efficiency ratios for Viasat, Inc. (VSAT).
- Dashboard and Charts: Visual summary of valuation outputs and assumptions for easy result analysis.
Disclaimer
All information, articles, and product details provided on this website are for general informational and educational purposes only. We do not claim any ownership over, nor do we intend to infringe upon, any trademarks, copyrights, logos, brand names, or other intellectual property mentioned or depicted on this site. Such intellectual property remains the property of its respective owners, and any references here are made solely for identification or informational purposes, without implying any affiliation, endorsement, or partnership.
We make no representations or warranties, express or implied, regarding the accuracy, completeness, or suitability of any content or products presented. Nothing on this website should be construed as legal, tax, investment, financial, medical, or other professional advice. In addition, no part of this site—including articles or product references—constitutes a solicitation, recommendation, endorsement, advertisement, or offer to buy or sell any securities, franchises, or other financial instruments, particularly in jurisdictions where such activity would be unlawful.
All content is of a general nature and may not address the specific circumstances of any individual or entity. It is not a substitute for professional advice or services. Any actions you take based on the information provided here are strictly at your own risk. You accept full responsibility for any decisions or outcomes arising from your use of this website and agree to release us from any liability in connection with your use of, or reliance upon, the content or products found herein.