
|
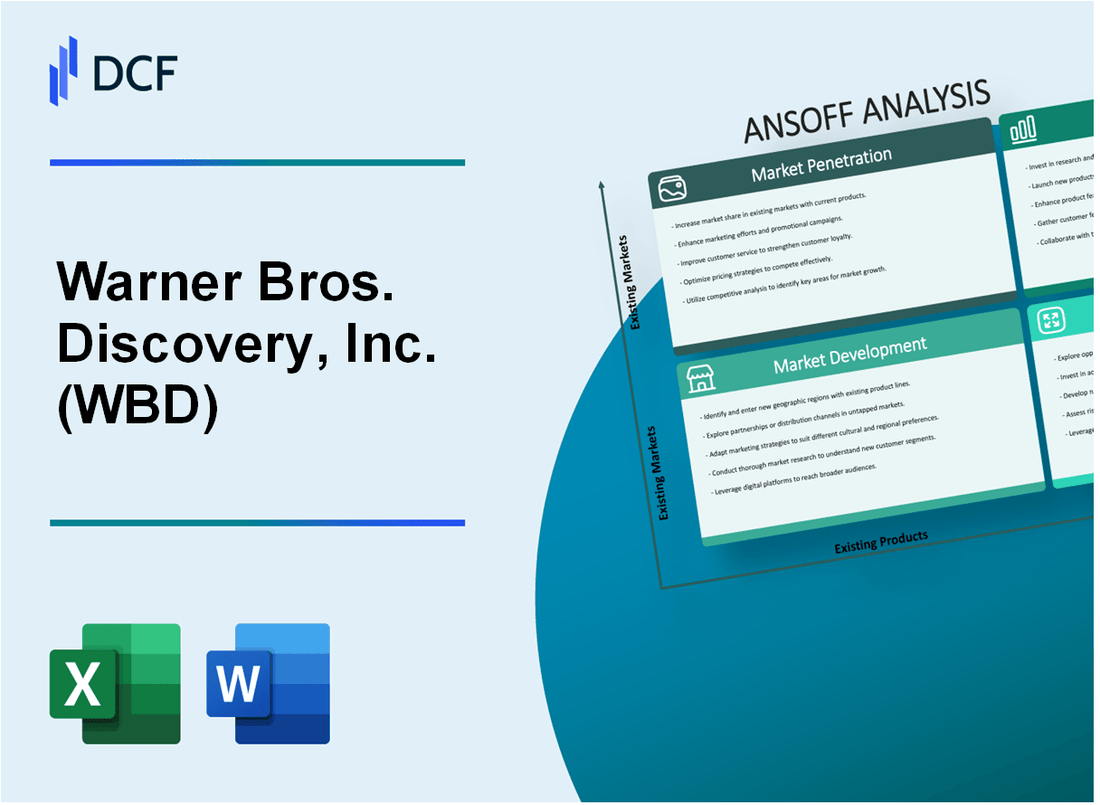
Warner Bros. Discovery, Inc. (WBD): ANSOFF MATRIX [Apr-2026 Updated] |
Totalmente Editável: Adapte-Se Às Suas Necessidades No Excel Ou Planilhas
Design Profissional: Modelos Confiáveis E Padrão Da Indústria
Pré-Construídos Para Uso Rápido E Eficiente
Compatível com MAC/PC, totalmente desbloqueado
Não É Necessária Experiência; Fácil De Seguir
Warner Bros. Discovery, Inc. (WBD) Bundle
You're looking at the Warner Bros. Discovery, Inc. roadmap and need to know where the real money is-forget the jargon, you need actionable steps. As someone who's spent the last decade leading analysis teams, I can tell you this Ansoff Matrix cuts straight to the chase, mapping near-term risks to high-impact moves. We're talking about aggressively bundling Max to snag another 5 million US households, pushing a low-cost mobile tier in Southeast Asia under $3, launching a premium 4K Max tier for an extra $3 per user, and even acquiring a gaming studio for AAA mobile titles. This isn't just strategy; it's a set of concrete financial targets for Warner Bros. Discovery, Inc. that you need to track below.
Warner Bros. Discovery, Inc. (WBD) - Ansoff Matrix: Market Penetration
You're looking at how Warner Bros. Discovery, Inc. (WBD) can push its existing Max streaming service deeper into its current US and international markets. This is about maximizing the value from the audience you already have access to, which is crucial when you've just reported 128.0 million global streaming subscribers as of the third quarter of 2025.
The strategy here centers on aggressive packaging and pricing optimization to drive immediate uptake and revenue per user. For instance, one key action is to aggressively bundle Max with existing cable subscriptions to capture an additional 5 million US households. This directly counters the ongoing pressure in the linear space, where domestic linear pay TV subscribers fell 9% year-over-year in Q3 2025.
To boost the lower-cost option, the plan involves increasing Max's ad-supported tier adoption by 15% through targeted, lower-cost promotional offers. This is important because domestic ARPU (Average Revenue Per User) has been under pressure, falling to $10.40 in Q3 2025, down from $11.15 in Q1 2025. The goal is to optimize Average Revenue Per User (ARPU) above $11.50 in mature markets by implementing dynamic pricing, aiming to recover from the Q3 domestic ARPU figure.
Here's a quick look at the current streaming financial snapshot for context:
| Metric | Value (Q3 2025) | Context/Goal |
| Global Streaming Subscribers | 128.0 million | Targeting 150 million by end of 2026 |
| Domestic Streaming ARPU | $10.40 | Targeting optimization above $11.50 |
| Streaming Segment Adjusted EBITDA | $345 million (Q3 Profit) | Projected full-year EBITDA over $1.3 billion |
| Ad-Supported Tier Adoption | Half of all new subscribers chose the ad-tier (as of May 2025) | Goal to increase adoption by 15% |
The connection between theatrical success and streaming penetration is also a focus. The plan is to drive theatrical attendance for core DC and Harry Potter IP by offering a 20% discount on Max subscriptions with ticket purchase. This leverages the strength seen in the Studios segment, where theatrical revenue increased 74% ex-FX in Q3 2025, contributing to a 23% ex-FX increase in overall content revenue for the quarter.
Finally, the company is managing significant costs related to its structural changes. The strategy involves maximizing the utilization of the remaining $1.5 billion in synergy savings to fund content marketing campaigns. To be fair, the Q3 2025 results showed $1.3 billion in pre-tax acquisition-related amortization of intangibles, content fair value step-up, and restructuring expenses included in the net loss, and $500 million in separation-related items impacted Free Cash Flow for that quarter. The focus remains on disciplined spending to support the content slate that drives these penetration efforts.
Here are the key levers for this Market Penetration push:
- Bundle Max with existing linear TV packages.
- Offer lower-cost promotional entry points for the ad-supported tier.
- Use theatrical ticket sales as a direct funnel to streaming sign-ups.
- Apply cost efficiencies to marketing spend.
- Adjust pricing based on market maturity to lift ARPU.
Finance: draft the Q4 2025 marketing budget allocation based on the expected synergy funding by next Tuesday.
Warner Bros. Discovery, Inc. (WBD) - Ansoff Matrix: Market Development
You're looking at how Warner Bros. Discovery, Inc. (WBD) pushes its existing Max product into new geographic territories. This is pure Market Development, and the numbers show a clear focus on scaling internationally.
The European rollout is definitely a major undertaking. You saw Max launch its Basic with Ads plan in Spain, Portugal, and Andorra starting April 8th, 2025. For example, Spain and Andorra were priced at €6.99 per month, while Portugal was set at €5.99 per month. This follows earlier launches in markets like France, Norway, Denmark, Finland, Romania, Poland, Netherlands, and Belgium. The company is aiming big, projecting a total of at least 150 million streaming subscribers globally by the end of 2026. Honestly, that's a big jump from the 128 million they reported exiting Q3 2025.
For emerging markets, like the Southeast Asia expansion which included Indonesia, Malaysia, the Philippines, Singapore, and Thailand starting November 19th, 2024, the pricing strategy reflects lower purchasing power. While I don't have the exact mobile-only tier price you mentioned, we can see the impact on revenue per user. WBD's international Average Revenue Per User (ARPU) dipped to $3.70 in Q3 2025, down from $4.05 in Q3 2024. This lower ARPU is directly attributed to these expansions into lower-priced international markets. That's the trade-off you make for subscriber volume.
To ensure regional relevance, WBD is investing in local stories. They launched the breakout Spanish original When Nobody Sees Us to appeal to local audiences. Also, the company is investing in localized content like The Eastern Gate in Europe to compete against local streaming giants. This is crucial for building that subscriber base, especially since the international base reached 70 million by Q3 2025.
Partnerships are key to accelerating this European push. For the upcoming direct-to-consumer launches in the UK and Ireland in March 2026, WBD struck a non-exclusive deal with Sky. This agreement is set to bring the ad-supported version of Max to approximately 10 million Sky customers by the second quarter of 2026. That kind of distribution leverage is hard to build alone.
On the news side, CNN International already has a strong footing in Latin America, being cited as the number one international TV news channel there. The digital expansion continues, with CNN Digital being a leading network for online news, mobile news, and social media. CNN's portfolio reaches more than 379 million households globally across all platforms.
Here's a quick look at the subscriber and revenue context for this international push:
| Metric | Q3 2025 Actual | Q4 2024 Actual | Target Year-End 2026 |
| Global Streaming Subscribers | 128 million | 116.9 million | 150 million |
| International Subscribers | 70 million | 59.8 million | N/A |
| International ARPU | $3.70 | N/A | N/A |
| Streaming Revenue (Q3) | $2.6 billion | N/A | N/A |
The strategy relies on a few core levers for growth in these new territories:
- Leverage existing IP like Harry Potter and DC Universe.
- Expand direct-to-consumer availability beyond licensing deals.
- Introduce ad-supported tiers for lower-cost access.
- Secure distribution via major telecom and cable partners.
- Increase localized content production for regional resonance.
Finance: draft 13-week cash view by Friday.
Warner Bros. Discovery, Inc. (WBD) - Ansoff Matrix: Product Development
You're looking at how Warner Bros. Discovery, Inc. (WBD) plans to grow by creating entirely new offerings for its existing customer base, primarily through the Max streaming service. This is the Product Development quadrant of the Ansoff Matrix, and it's all about adding new features or content types to keep your 128 million global streaming subscribers engaged and paying more.
The immediate focus here is on high-value content creation to justify price increases and drive higher Average Revenue Per User (ARPU). You're pushing to fast-track the development of 3-4 new, high-budget, unscripted reality franchises leveraging Discovery's deep expertise specifically for Max. This builds directly on the company's stated strategy of unveiling new unscripted commissions at its May 2025 upfronts.
For sports, the plan shifted from a separate revenue stream to an enhanced value proposition within existing tiers. The initial idea to launch a B/R Sports Add-On for $9.99 per month has been reversed. Now, the product development centers on integrating a premium, interactive sports betting layer directly into the existing Max experience for Standard and Premium subscribers. This leverages the existing content library, which boasts more than 1,700 live games and events annually across leagues like the NBA, NHL, and NCAA.
Here's a look at the Q3 2025 financial context supporting this content investment:
| Metric | Value (Q3 2025) | Context |
|---|---|---|
| Global Streaming Subscribers | 128.0 million | Targeting 150 million by end of 2026. |
| Total Adjusted EBITDA | $2.5 billion | Up 2% ex-FX year-over-year. |
| Streaming Adjusted EBITDA | $345 million | Increased 24% ex-FX year-over-year. |
| Free Cash Flow | $0.7 billion | Unfavorably impacted by $500 million in separation costs. |
| Gross Debt | $34.5 billion | Net leverage stood at 3.3x. |
Another key product development involves creating a dedicated direct-to-consumer (DTC) digital library for educational content. This move capitalizes on the vast, proven archives from Discovery Channel and Animal Planet. While the company is ramping up investment in factual entertainment globally, such as planning over 3,000 hours of programming in India for 2024, creating a distinct DTC educational product tests the monetization of this deep library outside the main Max offering.
To test new audience segments, you are greenlighting at least 2 new animated series based on lesser-used Warner Bros. intellectual property (IP). This is a targeted effort to see if established, but underutilized, IP can drive adoption among demographics not fully captured by the core HBO/Warner Bros. film slate.
Finally, the monetization of premium features is being sharpened. The goal is to launch a higher-priced, 4K/Dolby Atmos premium Max tier designed to capture an additional $3 per subscriber from high-end users. This builds on the existing structure where the top tier, which already includes 4K streaming and Dolby Atmos, costs $20.99 per month. Capturing an extra $3 from the current 128 million subscriber base represents a significant potential annual revenue lift if adoption is strong.
The product development initiatives center on:
- Securing 3-4 high-budget unscripted franchises for Max.
- Integrating interactive sports betting features into existing tiers.
- Developing a standalone DTC educational library.
- Launching a minimum of 2 new animated series.
- Targeting an incremental $3 ARPU from a new premium tier.
Finance: draft the projected content spend increase for the new unscripted slate by next Tuesday.
Warner Bros. Discovery, Inc. (WBD) - Ansoff Matrix: Diversification
You're looking at growth outside the core areas of subscription video on demand (SVOD) and traditional linear networks, which is smart given the Q3 2025 results showed total revenues at $9.0 billion, down 6% year-over-year, even as Adjusted EBITDA managed a slight 2% ex-FX increase to $2.5 billion. Diversification here means pushing owned intellectual property (IP) into new, high-margin or high-reach formats.
Mobile Gaming Studio Acquisition
The games segment is clearly volatile; Q3 2025 Games revenue dropped 23% ex-FX, following a 48% drop in Q1 2025. This signals that relying on a few big console/PC releases isn't a stable path. Acquiring a mid-sized mobile studio to develop 3-5 AAA mobile games based on core Warner Bros. Discovery franchises like Game of Thrones and DC is a direct move to stabilize and grow that revenue stream. The success of A Minecraft Movie, which grossed nearly $900 million worldwide, shows the latent value in the IP that isn't being fully captured in the current games slate.
Location-Based Entertainment (LBE) Ventures
To monetize the IP through physical experiences, establishing a dedicated Experience division to launch immersive, location-based entertainment venues is the next logical step. This bypasses the digital subscription fatigue. The goal here is aggressive, targeting $100 million in first-year revenue. For context, the Studios segment brought in $3,321 million in Q3 2025, so this LBE target represents about 3% of that segment's recent quarterly run rate, making it a meaningful, albeit new, revenue stream.
B2B Professional Development Services
Leveraging the factual content library for professional development via a B2B service targets a non-entertainment revenue source. Warner Bros. Discovery has a deep archive, which is a key differentiator against pure-play scripted streamers. To give you a sense of the library's scale, one analysis suggested that acquiring Warner Bros. Discovery would more than double a competitor's movie catalog by 189% and its show catalog by 123%. This vast library is the asset underpinning this B2B play.
Here's a look at the segment revenue context for Q3 2025:
| Segment | Q3 2025 Revenue (in millions) | YoY Change (Reported) |
| Streaming | $2,633 | - % (Flat ex-FX) |
| Studios | $3,321 | 24 % |
| Global Linear Networks | $3,883 | (22) % |
Metaverse Platform Investment
Investing in a minority stake in a metaverse platform secures early licensing and content rights for virtual Warner Bros. Discovery worlds. This is a low-capital entry into future digital real estate monetization. The company ended Q3 2025 with $4.3 billion in cash on hand, giving it the liquidity for strategic, non-core investments like this. It's about planting a flag where future consumer engagement might be.
Ad-Supported FAST Channel Portfolio
Launching a new, ad-supported, free-to-stream (FAST) channel portfolio directly addresses the advertising revenue challenge. Advertising revenues overall dropped 17% ex-FX in Q3 2025. However, the ad-supported streaming side shows promise; Q1 2025 streaming advertising revenue was up 35% ex-FX YoY, and Q3 streaming advertising rose 15%. The strategy is to capture non-subscriber ad revenue by using the archival library. Reports indicate that the company launched 60 FAST channels in 2025, which is a concrete action in this diversification area.
Key metrics related to the ad-supported streaming pivot:
- Q1 2025 Streaming Advertising Revenue Growth: 35% ex-FX YoY.
- Q3 2025 Streaming Advertising Revenue Growth: 15%.
- Total Streaming Subscribers (Q3 2025): 128.0 million.
- Streaming EBITDA Target for 2025: $1.3 billion.
Finance: draft 13-week cash view by Friday.
Disclaimer
All information, articles, and product details provided on this website are for general informational and educational purposes only. We do not claim any ownership over, nor do we intend to infringe upon, any trademarks, copyrights, logos, brand names, or other intellectual property mentioned or depicted on this site. Such intellectual property remains the property of its respective owners, and any references here are made solely for identification or informational purposes, without implying any affiliation, endorsement, or partnership.
We make no representations or warranties, express or implied, regarding the accuracy, completeness, or suitability of any content or products presented. Nothing on this website should be construed as legal, tax, investment, financial, medical, or other professional advice. In addition, no part of this site—including articles or product references—constitutes a solicitation, recommendation, endorsement, advertisement, or offer to buy or sell any securities, franchises, or other financial instruments, particularly in jurisdictions where such activity would be unlawful.
All content is of a general nature and may not address the specific circumstances of any individual or entity. It is not a substitute for professional advice or services. Any actions you take based on the information provided here are strictly at your own risk. You accept full responsibility for any decisions or outcomes arising from your use of this website and agree to release us from any liability in connection with your use of, or reliance upon, the content or products found herein.