
|
Warner Bros. Discovery, Inc. (WBD) Avaliação DCF |
Totalmente Editável: Adapte-Se Às Suas Necessidades No Excel Ou Planilhas
Design Profissional: Modelos Confiáveis E Padrão Da Indústria
Pré-Construídos Para Uso Rápido E Eficiente
Compatível com MAC/PC, totalmente desbloqueado
Não É Necessária Experiência; Fácil De Seguir
Warner Bros. Discovery, Inc. (WBD) Bundle
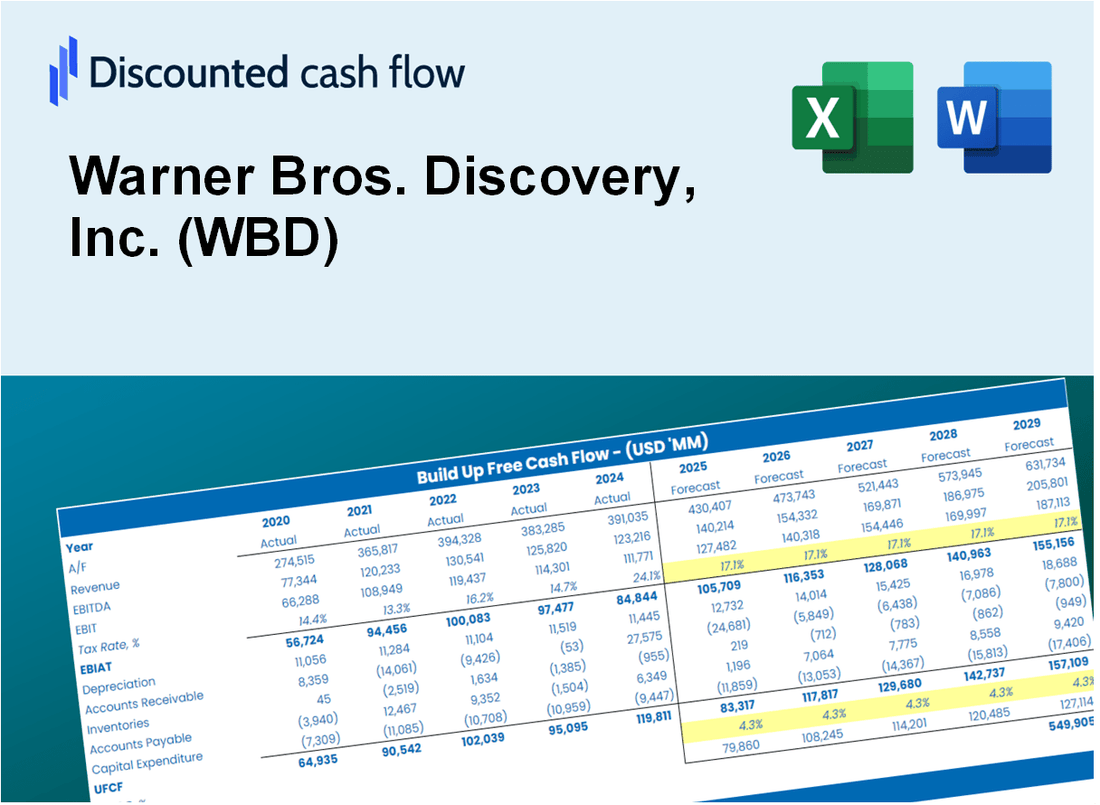
Projetado para precisão, nossa calculadora DCF (WBD) permite avaliar a avaliação da Warner Bros. Discovery, Inc. usando dados financeiros do mundo real, oferecendo flexibilidade completa para modificar todos os parâmetros essenciais para melhorar as projeções.
What You Will Get
- Editable Excel Template: A fully customizable Excel-based DCF Calculator featuring pre-filled real WBD financials.
- Real-World Data: Historical data and forward-looking estimates (as indicated in the yellow cells).
- Forecast Flexibility: Adjust forecast assumptions such as revenue growth, EBITDA %, and WACC.
- Automatic Calculations: Instantly observe the effects of your inputs on Warner Bros. Discovery’s valuation.
- Professional Tool: Designed for investors, CFOs, consultants, and financial analysts.
- User-Friendly Design: Organized for clarity and ease of use, complete with step-by-step instructions.
Key Features
- Comprehensive DCF Calculator: Features detailed unlevered and levered DCF valuation models tailored for Warner Bros. Discovery, Inc. (WBD).
- WACC Calculator: Ready-to-use Weighted Average Cost of Capital sheet with adjustable parameters specific to WBD.
- Customizable Forecast Assumptions: Adjust growth rates, capital expenditures, and discount rates to fit Warner Bros. Discovery's financial outlook.
- Integrated Financial Ratios: Evaluate profitability, leverage, and efficiency ratios for Warner Bros. Discovery, Inc. (WBD).
- Interactive Dashboard and Charts: Visual representations that summarize essential valuation metrics for streamlined analysis.
How It Works
- Download the Template: Gain immediate access to the Excel-based WBD DCF Calculator.
- Input Your Assumptions: Modify the yellow-highlighted cells for growth rates, WACC, margins, and more.
- Instant Calculations: The model automatically recalculates Warner Bros. Discovery's intrinsic value.
- Test Scenarios: Experiment with different assumptions to assess potential valuation variations.
- Analyze and Decide: Utilize the results to inform your investment or financial analysis.
Why Choose Warner Bros. Discovery, Inc. (WBD)?
- Extensive Content Library: Access a vast array of films and shows, catering to diverse audiences.
- Innovative Streaming Solutions: Cutting-edge technology enhances viewer experience across platforms.
- Global Reach: Engage with audiences worldwide, leveraging a strong international presence.
- Commitment to Quality: High production values ensure captivating storytelling and entertainment.
- Industry Leadership: A trusted name in media, recognized for excellence and creativity.
Who Should Use This Product?
- Investors: Evaluate Warner Bros. Discovery’s valuation before making stock transactions.
- CFOs and Financial Analysts: Optimize valuation methodologies and assess financial forecasts.
- Startup Founders: Understand the valuation strategies of leading media companies like Warner Bros. Discovery.
- Consultants: Provide comprehensive valuation analyses for clients in the media sector.
- Students and Educators: Utilize current data to explore and teach valuation principles.
What the Template Contains
- Preloaded WBD Data: Historical and projected financial data, including revenue, EBIT, and capital expenditures.
- DCF and WACC Models: Professional-grade sheets for calculating intrinsic value and Weighted Average Cost of Capital.
- Editable Inputs: Yellow-highlighted cells for adjusting revenue growth, tax rates, and discount rates.
- Financial Statements: Comprehensive annual and quarterly financials for deeper analysis.
- Key Ratios: Profitability, leverage, and efficiency ratios to evaluate performance.
- Dashboard and Charts: Visual summaries of valuation outcomes and assumptions.
Disclaimer
All information, articles, and product details provided on this website are for general informational and educational purposes only. We do not claim any ownership over, nor do we intend to infringe upon, any trademarks, copyrights, logos, brand names, or other intellectual property mentioned or depicted on this site. Such intellectual property remains the property of its respective owners, and any references here are made solely for identification or informational purposes, without implying any affiliation, endorsement, or partnership.
We make no representations or warranties, express or implied, regarding the accuracy, completeness, or suitability of any content or products presented. Nothing on this website should be construed as legal, tax, investment, financial, medical, or other professional advice. In addition, no part of this site—including articles or product references—constitutes a solicitation, recommendation, endorsement, advertisement, or offer to buy or sell any securities, franchises, or other financial instruments, particularly in jurisdictions where such activity would be unlawful.
All content is of a general nature and may not address the specific circumstances of any individual or entity. It is not a substitute for professional advice or services. Any actions you take based on the information provided here are strictly at your own risk. You accept full responsibility for any decisions or outcomes arising from your use of this website and agree to release us from any liability in connection with your use of, or reliance upon, the content or products found herein.