
|
Worksport Ltd. (WKSP) Avaliação DCF |
Totalmente Editável: Adapte-Se Às Suas Necessidades No Excel Ou Planilhas
Design Profissional: Modelos Confiáveis E Padrão Da Indústria
Pré-Construídos Para Uso Rápido E Eficiente
Compatível com MAC/PC, totalmente desbloqueado
Não É Necessária Experiência; Fácil De Seguir
Worksport Ltd. (WKSP) Bundle
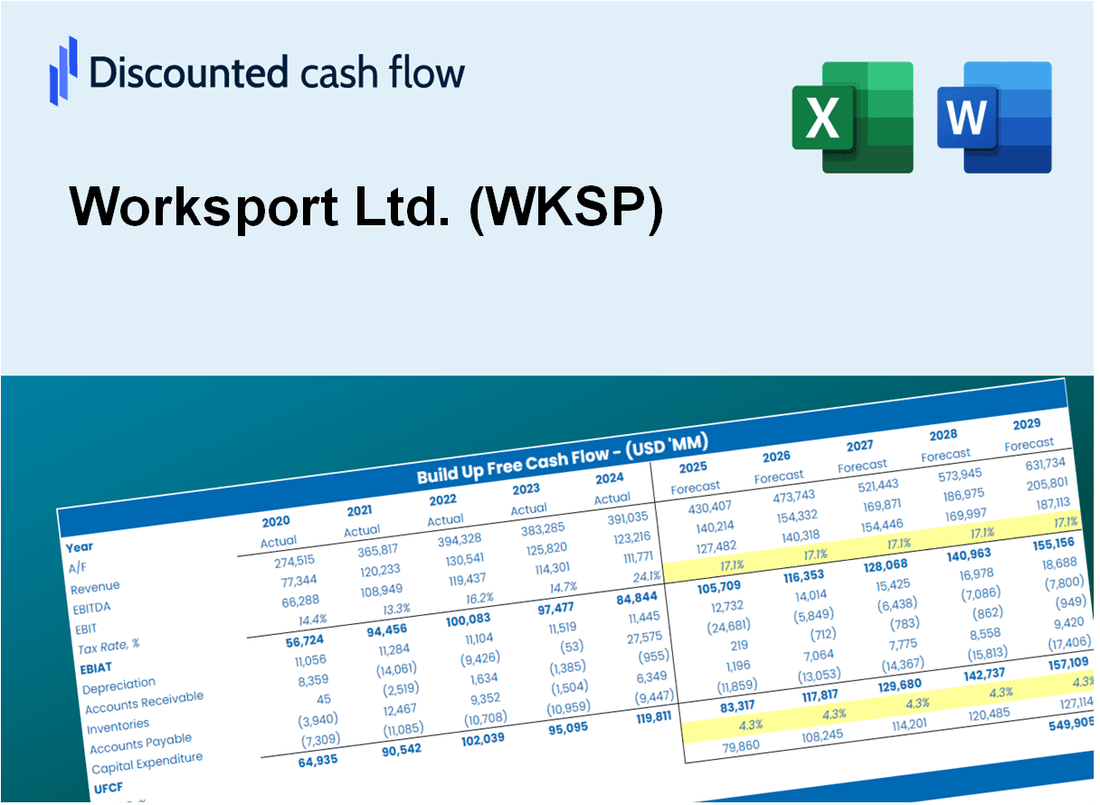
Como investidor ou analista, a calculadora DCF da Worksport Ltd. (WKSP) é o seu recurso preferido para uma avaliação precisa. Equipado com dados reais da Worksport Ltd., você pode ajustar as previsões e observar os resultados em tempo real.
What You Will Get
- Comprehensive WKSP Financial Data: Pre-loaded with Worksport Ltd.'s historical and projected data for thorough analysis.
- Fully Customizable Template: Easily adjust key inputs such as revenue growth, WACC, and EBITDA %.
- Instant Calculations: Watch Worksport's intrinsic value update in real-time as you make changes.
- Professional Valuation Tool: Tailored for investors, analysts, and consultants aiming for precise DCF outcomes.
- User-Friendly Interface: Intuitive layout and clear guidance suitable for all skill levels.
Key Features
- Comprehensive DCF Calculator: Offers detailed unlevered and levered DCF valuation frameworks tailored for Worksport Ltd. (WKSP).
- WACC Calculator: Features a pre-constructed Weighted Average Cost of Capital sheet with adjustable parameters.
- Customizable Forecast Assumptions: Easily adjust growth projections, capital investments, and discount rates.
- Integrated Financial Ratios: Evaluate profitability, leverage, and efficiency ratios specifically for Worksport Ltd. (WKSP).
- Interactive Dashboard and Charts: Visual representations present essential valuation metrics for straightforward analysis.
How It Works
- Download: Get the comprehensive Excel file featuring Worksport Ltd.’s (WKSP) financial data.
- Customize: Modify projections, including sales growth, EBITDA %, and discount rates.
- Update Automatically: The intrinsic value and NPV calculations refresh in real-time.
- Test Scenarios: Generate various forecasts and analyze results immediately.
- Make Decisions: Leverage the valuation insights to inform your investment approach.
Why Choose This Calculator for Worksport Ltd. (WKSP)?
- All-in-One Solution: Combines DCF, WACC, and financial ratio analyses tailored for Worksport Ltd.
- Flexible Inputs: Modify yellow-highlighted cells to explore different scenarios specific to WKSP.
- In-Depth Analysis: Automatically computes Worksport Ltd.'s intrinsic value and Net Present Value.
- Preloaded Information: Access historical and projected data for reliable baseline assessments.
- High-Quality Standards: Perfect for financial analysts, investors, and business consultants focusing on WKSP.
Who Should Use This Product?
- Investors: Evaluate Worksport Ltd.'s (WKSP) market position before making investment decisions.
- CFOs and Financial Analysts: Optimize valuation methodologies and assess financial forecasts for Worksport Ltd. (WKSP).
- Startup Founders: Gain insights into how innovative companies like Worksport Ltd. (WKSP) are appraised.
- Consultants: Provide comprehensive valuation assessments for clients interested in Worksport Ltd. (WKSP).
- Students and Educators: Utilize real-time data from Worksport Ltd. (WKSP) to enhance learning and teaching of valuation principles.
What the Template Contains
- Historical Data: Includes Worksport Ltd.'s (WKSP) past financials and baseline forecasts.
- DCF and Levered DCF Models: Detailed templates to calculate Worksport Ltd.'s (WKSP) intrinsic value.
- WACC Sheet: Pre-built calculations for Weighted Average Cost of Capital.
- Editable Inputs: Modify key drivers like growth rates, EBITDA %, and CAPEX assumptions.
- Quarterly and Annual Statements: A complete breakdown of Worksport Ltd.'s (WKSP) financials.
- Interactive Dashboard: Visualize valuation results and projections dynamically.
Disclaimer
All information, articles, and product details provided on this website are for general informational and educational purposes only. We do not claim any ownership over, nor do we intend to infringe upon, any trademarks, copyrights, logos, brand names, or other intellectual property mentioned or depicted on this site. Such intellectual property remains the property of its respective owners, and any references here are made solely for identification or informational purposes, without implying any affiliation, endorsement, or partnership.
We make no representations or warranties, express or implied, regarding the accuracy, completeness, or suitability of any content or products presented. Nothing on this website should be construed as legal, tax, investment, financial, medical, or other professional advice. In addition, no part of this site—including articles or product references—constitutes a solicitation, recommendation, endorsement, advertisement, or offer to buy or sell any securities, franchises, or other financial instruments, particularly in jurisdictions where such activity would be unlawful.
All content is of a general nature and may not address the specific circumstances of any individual or entity. It is not a substitute for professional advice or services. Any actions you take based on the information provided here are strictly at your own risk. You accept full responsibility for any decisions or outcomes arising from your use of this website and agree to release us from any liability in connection with your use of, or reliance upon, the content or products found herein.