
|
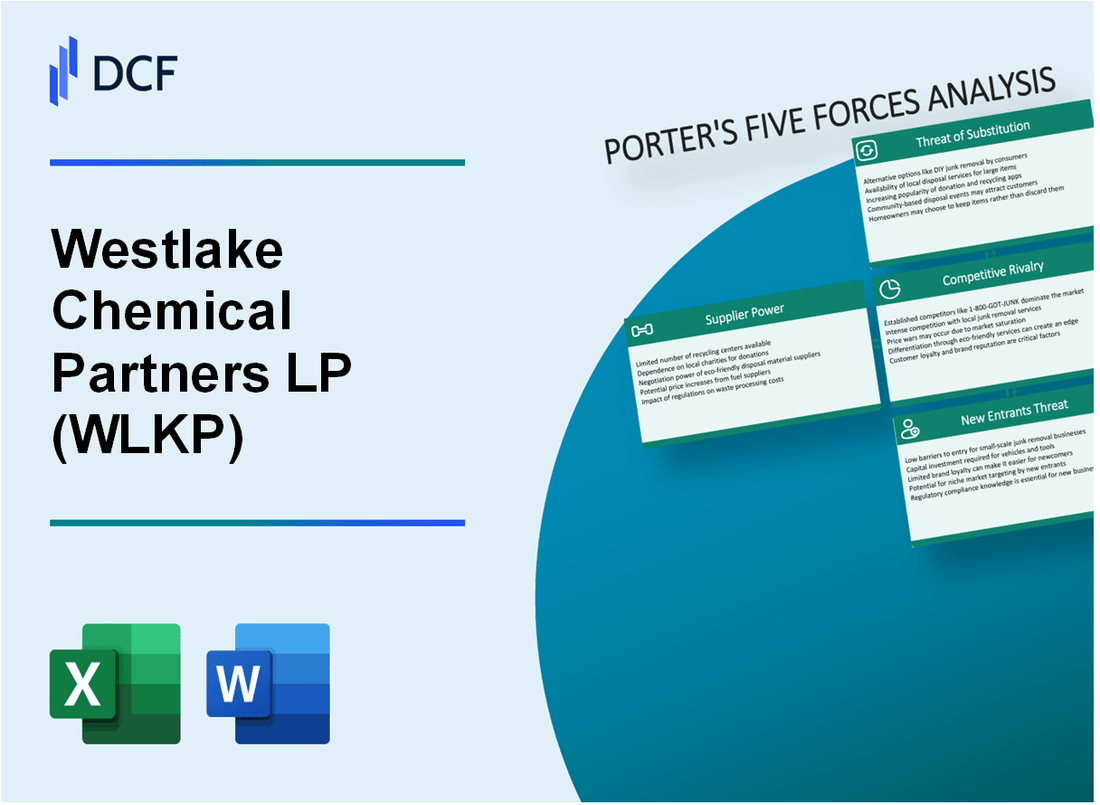
Westlake Chemical Partners LP (WLKP): 5 forças Análise [Jan-2025 Atualizada] |
Totalmente Editável: Adapte-Se Às Suas Necessidades No Excel Ou Planilhas
Design Profissional: Modelos Confiáveis E Padrão Da Indústria
Pré-Construídos Para Uso Rápido E Eficiente
Compatível com MAC/PC, totalmente desbloqueado
Não É Necessária Experiência; Fácil De Seguir
Westlake Chemical Partners LP (WLKP) Bundle
No mundo dinâmico da fabricação química, o Westlake Chemical Partners LP navega em um cenário competitivo complexo, onde o posicionamento estratégico é tudo. Ao dissecar as forças complexas que moldam seu ecossistema de negócios, revelamos os fatores críticos que determinam a resiliência, a lucratividade e o potencial da empresa na indústria petroquímica altamente competitiva. Desde as relações de fornecedores até as rivalidades do mercado, essa análise fornece um instantâneo abrangente dos desafios e oportunidades estratégicas do WLKP em 2024, oferecendo informações que vão além das métricas financeiras tradicionais.
Westlake Chemical Partners LP (WLKP) - As cinco forças de Porter: poder de barganha dos fornecedores
Número limitado de fornecedores de etileno e propileno
Em 2024, o tamanho do mercado global de etileno é de aproximadamente 180 milhões de toneladas métricas anualmente. Os 5 principais produtores globais de etileno controlam aproximadamente 45% do mercado, incluindo:
| Empresa | Quota de mercado | Produção anual |
|---|---|---|
| ExxonMobil Chemical | 12.5% | 22,5 milhões de toneladas métricas |
| Corporação Indústria Básica Saudita (SABIC) | 10.2% | 18,4 milhões de toneladas métricas |
| Dow Chemical | 9.8% | 17,6 milhões de toneladas métricas |
Contratos de fornecimento com a empresa controladora
A Westlake Chemical Partners possui acordos de fornecimento de longo prazo com a Westlake Chemical Corporation, que fornece:
- Fornecimento garantido de 500.000 toneladas de etileno anualmente
- Mecanismos de preços fixos com ajustes anuais
- Termos contratuais que se estendem até 2030
Impacto de integração vertical
A integração vertical de Westlake reduz o poder de barganha do fornecedor através de:
- Propriedade de várias instalações de produção
- Controle direto sobre 65% do fornecimento de matérias -primas
- Capacidade de produção interna de 3,5 milhões de toneladas métricas de petroquímicos anualmente
Volatilidade do preço da matéria -prima petroquímica
Flutuações de preços de etileno e propileno para 2023-2024:
| Ano | Preço médio por tonelada | Faixa de volatilidade de preços |
|---|---|---|
| 2023 | $1,200 | ±15% |
| 2024 (projetado) | $1,350 | ±12% |
Westlake Chemical Partners LP (WLKP) - As cinco forças de Porter: poder de barganha dos clientes
Análise de base de clientes concentrada
A partir do quarto trimestre 2023, a Westlake Chemical Partners LP atende a aproximadamente 37 clientes industriais importantes nos mercados de polietileno e plásticos especializados. As métricas de concentração de clientes revelam:
| Segmento de clientes | Quota de mercado | Volume anual de compra |
|---|---|---|
| Fabricantes de embalagens | 42% | 1,2 milhão de toneladas métricas |
| Componentes automotivos | 28% | 850.000 toneladas métricas |
| Materiais de construção | 18% | 520.000 toneladas métricas |
| Bens de consumo | 12% | 350.000 toneladas métricas |
Opções de troca de clientes
A troca de custos para os clientes estimados em US $ 4,7 milhões por transição, criando barreiras moderadas para mudar os fornecedores.
- Despesas de recertificação técnica: US $ 2,3 milhões
- Retooling Processos de fabricação: US $ 1,5 milhão
- Penalidades contratuais: US $ 900.000
Acordos de fornecimento de longo prazo
A Westlake Chemical Partners mantém 8 contratos de fornecimento de longo prazo com valores anuais de contrato que variam de US $ 45 milhões a US $ 127 milhões.
Dinâmica de sensibilidade ao preço
Os setores de fabricação a jusante exibem elasticidade de preços de 0,65, indicando sensibilidade moderada às flutuações de preços.
| Setor de manufatura | Índice de Sensibilidade ao Preço | Valor médio anual do contrato |
|---|---|---|
| Embalagem | 0.58 | US $ 87,3 milhões |
| Automotivo | 0.72 | US $ 65,4 milhões |
| Construção | 0.49 | US $ 53,6 milhões |
Westlake Chemical Partners LP (WLKP) - As cinco forças de Porter: rivalidade competitiva
Cenário competitivo na fabricação petroquímica
Em 2024, a Westlake Chemical Partners LP opera em um mercado petroquímico altamente competitivo com a seguinte dinâmica competitiva:
| Concorrente | Capitalização de mercado | Receita anual |
|---|---|---|
| LyondellBasell Industries | US $ 47,3 bilhões | US $ 52,6 bilhões |
| Dow Chemical Company | US $ 35,8 bilhões | US $ 56,7 bilhões |
| Westlake Chemical Partners LP | US $ 2,1 bilhões | US $ 1,4 bilhão |
Capacidades competitivas
Os principais recursos competitivos incluem:
- Pegada de fabricação norte -americana com 4 instalações de produção primárias
- Capacidade anual de produção de 3,8 milhões de toneladas de petroquímicos
- Participação de mercado regional em polietileno: 6,2%
- Portfólio de produtos especializado em produtos químicos de vinil e desempenho
Estratégias de diferenciação de mercado
As ofertas especializadas de produtos incluem:
- Polietileno de alta densidade (HDPE)
- Resinas de vinil especializadas
- Aditivos de desempenho para aplicações industriais
Vantagens regionais de mercado
Posicionamento competitivo de fabricação química na América do Norte:
| Métrica | Valor |
|---|---|
| Tamanho total do mercado de fabricação química norte -americana | US $ 801 bilhões |
| Participação de mercado regional do WLKP | 1.7% |
| Vantagem média de custo de produção | 12.4% |
Westlake Chemical Partners LP (WLKP) - As cinco forças de Porter: ameaça de substitutos
Materiais alternativos em indústrias de embalagens e construção
O tamanho do mercado de alternativas de embalagens globais atingiu US $ 909,4 bilhões em 2022, com materiais de substituição crescendo a 5,2% de CAGR.
| Tipo de material | Quota de mercado (%) | Taxa de crescimento |
|---|---|---|
| Embalagem de vidro | 22.3% | 4,7% CAGR |
| Recipientes de metal | 18.6% | 3,9% CAGR |
| Papel/papelão | 35.2% | 6,1% CAGR |
Concorrência crescente de alternativas de plástico de base biológica e reciclada
O mercado global de plásticos de base biológica se projetou para atingir US $ 12,7 bilhões até 2025, com uma taxa de crescimento anual de 15,3%.
- Valor de mercado plástico reciclado estimado em US $ 47,8 bilhões em 2023
- Taxa de reciclagem de polietileno tereftalato (PET) em 29,1% globalmente
- Capacidade de produção bioplástica, atingindo 2,16 milhões de toneladas métricas anualmente
Avanços tecnológicos na ciência do material
Os investimentos em P&D de ciências materiais atingiram US $ 185,3 bilhões em 2022, com foco em alternativas sustentáveis.
| Tecnologia | Investimento ($ b) | Estágio de desenvolvimento |
|---|---|---|
| Polímeros biodegradáveis | 42.6 | Avançado |
| Materiais nano-compostos | 37.9 | Emergente |
| Compostos sustentáveis | 55.8 | Maduro |
Aumentar os regulamentos ambientais que afetam os produtos plásticos tradicionais
O cenário global de regulamentação plástica mostra 482 medidas legislativas implementadas em 34 países em 2023.
- Proibições de plástico de uso único em 77 países
- Leis de responsabilidade do produtor estendido, cobrindo 62% das regiões de fabricação globais
- Implicações do imposto sobre o carbono aumentando a adoção de material alternativo em 8,3%
Westlake Chemical Partners LP (WLKP) - As cinco forças de Porter: ameaça de novos participantes
Requisitos de investimento de capital
As instalações de fabricação química da Westlake Chemical Partners LP requerem investimento substancial de capital. Em 2024, o gasto inicial estimado de capital para uma nova instalação de produção química varia entre US $ 50 milhões e US $ 250 milhões, dependendo da capacidade de produção e da complexidade tecnológica.
| Categoria de investimento | Faixa de custo estimada |
|---|---|
| Aquisição de terras | US $ 5 milhões - US $ 20 milhões |
| Construção da instalação | US $ 30 milhões - US $ 150 milhões |
| Instalação do equipamento | US $ 15 milhões - US $ 80 milhões |
Barreiras regulatórias
Regulamentos ambientais e de segurança Crie barreiras de entrada significativas para novos fabricantes de produtos químicos.
- Custos de conformidade da EPA: aproximadamente US $ 2,5 milhões - US $ 10 milhões anualmente
- Despesas de certificação de segurança: US $ 500.000 - US $ 3 milhões
- Avaliação de impacto ambiental: US $ 250.000 - US $ 1,5 milhão
Economias de escala
Westlake Chemical Partners LP se beneficia das economias de escala estabelecidas:
| Métrica de produção | Desempenho atual |
|---|---|
| Volume anual de produção | 2,3 milhões de toneladas métricas |
| Custo por unidade de redução | 18,5% em comparação com fabricantes menores |
Barreiras tecnológicas
A produção química especializada envolve requisitos tecnológicos complexos:
- Investimento de P&D: US $ 45 milhões em 2023
- Portfólio de patentes: 87 patentes de processo químico ativo
- Investimento avançado de tecnologia de fabricação: US $ 22 milhões em 2024
Westlake Chemical Partners LP (WLKP) - Porter's Five Forces: Competitive rivalry
You see the competitive rivalry in the US ethylene space as intense, and the numbers definitely back that up. The industry faced high rivalry, largely driven by capacity additions that outpaced immediate demand. You know that US ethylene operating rates fell to approximately 80% in 2023 due to this capacity expansion. That oversupply dynamic definitely pressures margins for uncontracted volumes.
The broader chemical landscape in 2025 isn't exactly roaring, either. Global industrial activity remains soft, which broadly impacts the chemical industry's pricing power. For instance, global chemical production growth is forecast to slow to around 2.1% for the full year 2025, a significant deceleration from the rebound seen in 2024. Furthermore, US chemical exports in 2025 are projected to hit their lowest level since 2020.
To give you a clearer picture of the market Westlake Chemical Partners LP operates within, here are some key industry metrics for 2025:
| Metric | Value / Projection for 2025 |
| Global Chemical Industry Size | USD 6,324 billion |
| Projected Global Chemical Production Growth | 1.9% to 2.1% |
| Projected US Chemical Production Volume Growth | 1.9% |
| US Ethylene Capacity Growth (Next 10 Years) | 11,000 KTPA |
Still, Westlake Chemical Partners LP's financial results are largely insulated from this market rivalry because of its fixed-margin contract with Westlake Corporation (WLK). This structure fundamentally changes how you should view WLKP's competitive position compared to merchant producers. The bedrock of this stability is the long-term ethylene sales agreement.
Here are the concrete terms that provide that insulation:
- WLKP sells 95% of the facilities' ethylene production to WLK.
- The agreed-upon margin is a fixed $0.10 per pound.
- This agreement is currently set to run through the end of 2026.
- For context on recent operational impacts, MLP distributable cash flow for the second quarter of 2025 was $15.0 million.
- In Q2 2025, OpCo's net income benefitted by $13.6 million due to the contract offsetting lower production from the Petro 1 turnaround.
This contractual arrangement means that even when the broader US ethylene market is pressured by overcapacity-as evidenced by US Gulf Coast cracker rates averaging around 87% in 2024-WLKP's primary revenue stream remains protected. Finance: draft 13-week cash view by Friday.
Westlake Chemical Partners LP (WLKP) - Porter's Five Forces: Threat of substitutes
When looking at the threat of substitutes for Westlake Chemical Partners LP (WLKP), you need to focus on the end-markets for its core products, primarily polyethylene. The pressure here is mounting from regulatory action and shifting consumer preferences, which directly challenge the dominance of virgin petrochemicals.
Growing regulatory and consumer pressure against single-use plastics, a key end-market for polyethylene
The regulatory environment is definitely tightening around single-use plastics, which is a major application for polyethylene. This isn't just talk; it's translating into mandates that affect demand for virgin resin. For instance, the EU Packaging and Packaging Waste Regulation (PPWR) started applying its recyclability standards and recycled-content requirements from August 2025 onward. Also, in the U.S., California's Assembly Bill 793 requires beverage containers to contain 25% recycled content as of 2025, ratcheting up to 50% by 2030. These rules force brand owners to seek out recycled or alternative materials, directly impacting the demand profile for WLKP's primary outputs.
The overall market context shows this pressure is against a massive backdrop. The Global Polyethylene Market was valued at USD 120 billion in 2024 and is still projected to grow at a CAGR of 5.5% through 2030. However, this growth is increasingly contested by sustainability mandates. Furthermore, global plastic garbage production is expected to exceed 460 million tonnes per year by 2025, which keeps the environmental debate front and center.
Bio-based and recycled plastics represent a long-term, non-petrochemical substitute threat
The shift toward circular materials is creating a measurable, quantifiable substitute market. Recycled plastics are not just a niche anymore; they are a significant segment with their own growth trajectory. The global recycled plastic market size is projected to grow from US$ 64.4 billion in 2025 to US$ 120.1 billion by 2032, growing at a CAGR of 9.3%. This growth is fueled by the very regulations mentioned above.
To be fair, circular plastics-which include both recycled and bio-based materials-accounted for 9.5% of total global plastics production back in 2022 at 38 million tonnes. While this percentage is still relatively small compared to virgin production, the growth rate of the substitute market is faster than the overall polyethylene market growth rate of 5.5%. The demand for post-consumer recycled (PCR) plastics is particularly strong in packaging, which is a key area for WLKP.
Here are some key figures showing the scale of the substitute markets as of 2025:
| Market Segment | Value in 2025 (USD) | Projected CAGR (Next Period) |
|---|---|---|
| Global Recycled Plastic Market Size | $64.4 billion | 9.3% (to 2032) |
| Europe Bioplastics and Biopolymers Market Size | $8.08 billion | 17.66% (to 2035) |
| Recycled Polypropylene in Packaging Market Size | $9.85 billion | 6.73% (to 2034) |
| Recycled Polyethylene Terephthalate (rPET) Market Size | $12.76 billion | N/A (Growth to $26.78B by 2034) |
Alternative polymers (e.g., polypropylene) can substitute for polyethylene in some packaging applications
Polypropylene (PP) is a direct competitor in certain packaging niches where polyethylene (PE) is traditionally used. Companies are actively redesigning packaging to use mono-material solutions, and PP is often the material of choice for its barrier properties and recyclability profile. For example, in the UK, PP makes up around one third of PET, PP, and PS used in fresh fruit and vegetable packaging.
The market for alternatives to traditional plastics is growing rapidly, indicating substitution is happening now. The plastic alternative packaging market grew from $6.22 billion in 2024 to $7.24 billion in 2025, representing a 16.5% growth rate for that year alone. This suggests that in specific, often high-visibility, packaging segments, the threat from polymers like PP, especially recycled PP, is immediate and accelerating.
The growth in recycled PP specifically highlights this substitution pressure:
- Recycled polypropylene in packaging is forecast to reach USD 17.66 billion by 2034 from USD 9.85 billion in 2025.
- This growth is driven by its balance of durability, performance, and environmental benefits.
- The non-bottle rigid segment, where PP is strong, is the fastest-growing source segment in the post-consumer recycled plastic market.
Ethylene itself, as a foundational petrochemical building block, currently lacks a cheap, direct substitute for its scale
While the downstream products face substitution threats, the foundational molecule, ethylene, is much harder to replace at the massive scale required by the industry. Conventional ethane-based ethylene production showed a Levelized Cost of Ethylene (LCOE) of $746 per tonne-ethylene. Any alternative carbon source (ACS) technology must compete with this established cost structure.
The industry is exploring alternatives, but they face significant hurdles in cost and scale:
- Waste plastic pyrolysis is currently cited as the most competitive ACS-based technology for ethylene production at the cluster level.
- However, this relies on a large, consistent availability of plastic waste, which is challenging given that only 9% to 14% of plastics are globally recycled.
- Other routes, like converting $\text{CO}_2$ into ethylene, are in early commercialization; for example, LanzaTech Global, Inc. received a $30 million grant in March 2024 for a commercial-scale plant.
- Bioethanol-to-ethylene technology has reached a moderate Technology Readiness Level (TRL) of 6-7.
So, while the long-term direction is clear, the near-term, cost-effective, direct replacement for the sheer volume of ethylene produced via traditional cracking simply isn't there yet. Finance: draft the Q4 2025 capital expenditure forecast, focusing on sustainability-linked projects by Friday.
Westlake Chemical Partners LP (WLKP) - Porter's Five Forces: Threat of new entrants
The barrier to entry for new competitors in the ethylene production space, which Westlake Chemical Partners LP's OpCo operates within, remains exceptionally high, primarily due to the sheer scale of required investment and established infrastructure.
Ethylene production requires massive capital investment for steam cracker construction; OpCo's capacity is approximately 3.7 billion pounds annually across its three facilities located in Calvert City, Kentucky, and Lake Charles, Louisiana. Greenfield projects demand substantial upfront capital expenditure (CAPEX) for land acquisition, infrastructure, and equipment installation. For context on the scale, a single announced new large ethane cracker project, the Coastal Plain Project, is valued at $8.6 billion.
| Metric | Data Point | Context/Reference |
|---|---|---|
| Westlake Chemical Partners LP (OpCo) Annual Ethylene Capacity | 3.7 billion pounds | Aggregate capacity of three production facilities |
| Example New Greenfield Ethane Cracker Project Cost | $8.6 billion | Exxon Coastal Plain Project estimate |
| Estimated Ethane Steam Cracking CAPEX (Historical Benchmark) | USD 1,500 /tHVC | Assumed CAPEX for ethane steam cracking technology |
| US Ethylene Capacity Expansion Announced (as of June 2025) | 14 projects | Number of announced or moving-ahead new/expansion projects |
| Potential Capacity Increase if Half of Announced Projects are Built | 9.19 million metric tons per year | Represents a 21 percent increase over current levels if realized |
Significant regulatory hurdles and complex permitting processes create high entry barriers. The construction of new, large-scale petrochemical facilities like steam crackers involves navigating extensive environmental reviews, which can significantly delay or halt projects. For instance, new and expanding plants have permit records indicating potential increases in climate-warming emissions by over 27 million tons annually.
New entrants require access to integrated infrastructure, including pipelines and storage, like WLKP's 200-mile ethylene pipeline connecting Mont Belvieu, TX, to Longview, TX. Building out this necessary logistics network adds another layer of cost and time. For example, Chinese companies investing in U.S. ethane processing capacity are also investing over $16 billion in associated infrastructure, including storage and Very Large Ethane Carriers (VLECs), where a single VLEC costs $160 million-$170 million to build.
Current industry overcapacity and low margins for non-integrated producers discourage new greenfield projects. Globally, utilization rates for commodities like ethylene have plummeted, remaining well below historical averages. Petrochemical producers worldwide are facing their lowest margins in over a decade, with average EBITDA dropping from 17% to 12%. While US Gulf Coast cracker rates were around 87%, European rates averaged only 60%-70% through 2024. Elevated feedstock costs, such as the 1.9% increase in natural gas prices in the second week of October 2025, further reduce producer margins, disincentivizing new supply additions.
- Global ethylene utilization rates are well below historical averages.
- Petrochemical EBITDA margins fell from 17% to 12% over the 2019-2024 period.
- WLKP's OpCo sells approximately 95% of its ethylene production under a long-term agreement with a stable margin.
- The US market saw ethylene prices surge 4.6% in the second week of October 2025, yet elevated feedstock costs compressed margins.
Disclaimer
All information, articles, and product details provided on this website are for general informational and educational purposes only. We do not claim any ownership over, nor do we intend to infringe upon, any trademarks, copyrights, logos, brand names, or other intellectual property mentioned or depicted on this site. Such intellectual property remains the property of its respective owners, and any references here are made solely for identification or informational purposes, without implying any affiliation, endorsement, or partnership.
We make no representations or warranties, express or implied, regarding the accuracy, completeness, or suitability of any content or products presented. Nothing on this website should be construed as legal, tax, investment, financial, medical, or other professional advice. In addition, no part of this site—including articles or product references—constitutes a solicitation, recommendation, endorsement, advertisement, or offer to buy or sell any securities, franchises, or other financial instruments, particularly in jurisdictions where such activity would be unlawful.
All content is of a general nature and may not address the specific circumstances of any individual or entity. It is not a substitute for professional advice or services. Any actions you take based on the information provided here are strictly at your own risk. You accept full responsibility for any decisions or outcomes arising from your use of this website and agree to release us from any liability in connection with your use of, or reliance upon, the content or products found herein.