|
Waste Management, Inc. (WM): 5 forças Análise [Jan-2025 Atualizada] |
Totalmente Editável: Adapte-Se Às Suas Necessidades No Excel Ou Planilhas
Design Profissional: Modelos Confiáveis E Padrão Da Indústria
Pré-Construídos Para Uso Rápido E Eficiente
Compatível com MAC/PC, totalmente desbloqueado
Não É Necessária Experiência; Fácil De Seguir
Waste Management, Inc. (WM) Bundle
No cenário dinâmico do gerenciamento de resíduos, o Waste Management, Inc. (WM) navega por um complexo ecossistema de forças competitivas que moldam suas decisões estratégicas e posicionamento de mercado. Desde a intrincada dança das negociações de fornecedores até os desafios em evolução da interrupção tecnológica, essa análise retira as camadas da dinâmica competitiva do setor usando a renomada estrutura das Five Forces de Michael Porter. Descubra como a WM equilibra a inovação tecnológica, as pressões regulatórias e a concorrência de mercado para manter sua liderança em um ecossistema de gerenciamento de resíduos cada vez mais sofisticado.
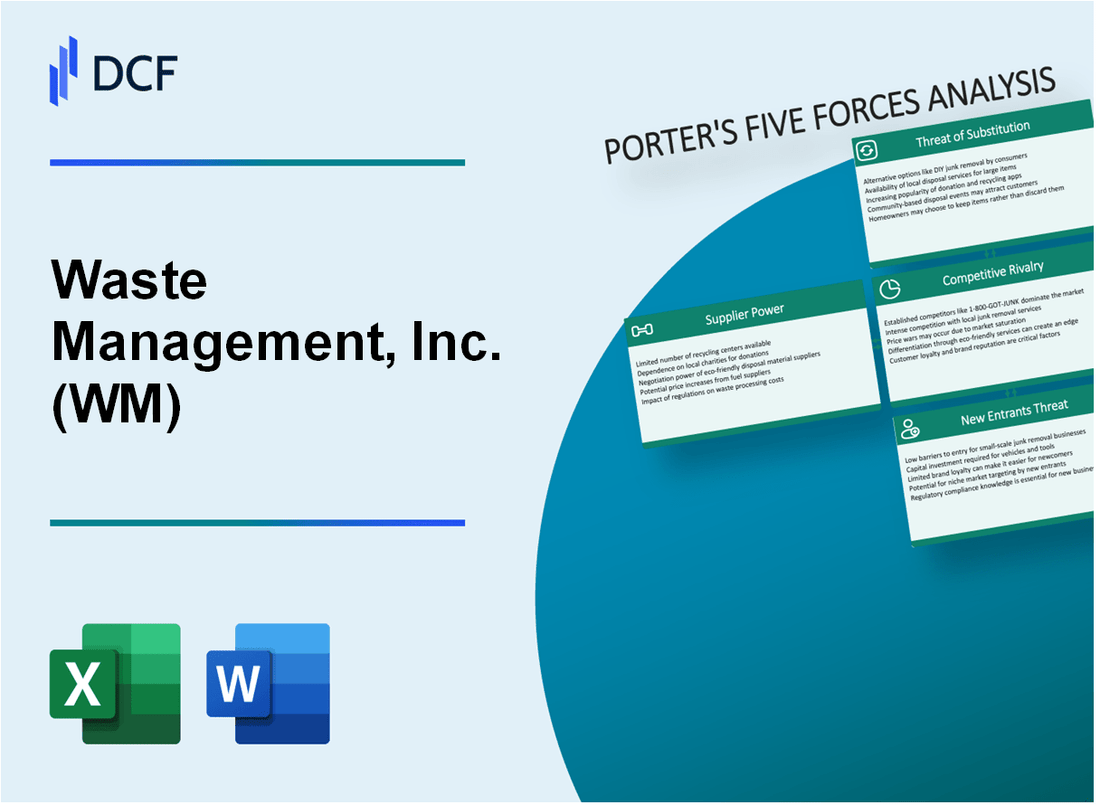
Waste Management, Inc. (WM) - As cinco forças de Porter: poder de barganha dos fornecedores
Número limitado de fabricantes de equipamentos de coleta e descarte de resíduos especializados
A partir de 2024, o mercado de equipamentos de gerenciamento de resíduos é caracterizado por uma base concentrada de fornecedores. Aproximadamente 3-4 grandes fabricantes globais dominam o mercado de veículos de coleta de resíduos especializados, incluindo:
| Fabricante | Quota de mercado | Receita anual (2023) |
|---|---|---|
| Heil Environmental | 35% | US $ 1,2 bilhão |
| Caminhão McNeilus & Fabricação | 27% | US $ 890 milhões |
| Novos caminhões | 18% | US $ 620 milhões |
Altos custos de comutação para equipamentos de gerenciamento de resíduos
Waste Management, Inc. enfrenta barreiras significativas para trocar de equipamento:
- Caminhão médio de coleta de resíduos Custo: US $ 250.000 - US $ 350.000
- Ciclo de substituição da frota: 7-10 anos
- Custos de personalização: US $ 50.000 - US $ 75.000 por veículo
Dependência de fornecedores de combustível para operações de frota
Despesas com combustível para a frota da Waste Management, Inc. em 2023:
| Tipo de combustível | Consumo anual | Custo total |
|---|---|---|
| Diesel | 45 milhões de galões | US $ 165 milhões |
| Gás natural comprimido | 12 milhões de galões equivalentes | US $ 48 milhões |
Mercado concentrado de provedores de tecnologia de gerenciamento de resíduos
Os principais fornecedores de tecnologia para soluções de gerenciamento de resíduos:
- Resíduos: 40% participação de mercado na fabricação de contêineres de resíduos
- Sistemas avançados de descarte: fornece tecnologias especializadas de classificação de resíduos
- Investimento de tecnologia total por WM em 2023: US $ 87 milhões
Waste Management, Inc. (WM) - As cinco forças de Porter: poder de barganha dos clientes
Diversificadas Base de Clientes
A Waste Management, Inc. atende a aproximadamente 21 milhões de clientes residenciais, 5,1 milhões de contas comerciais e mais de 200 governos municipais a partir do quarto trimestre de 2023.
| Segmento de clientes | Número de clientes | Contribuição da receita |
|---|---|---|
| residencial | 21 milhões | 42% da receita total |
| Comercial | 5,1 milhões | 38% da receita total |
| Municipal | Mais de 200 governos | 20% da receita total |
Trocar custos
Duração média do contrato: 3-5 anos para serviços de resíduos comerciais e municipais.
- Custos estimados de troca: US $ 15.000 - US $ 50.000 por cliente comercial
- As multas municipais de rescisão do contrato variam de 2-7% do valor total do contrato
Sensibilidade ao preço
Os preços médios da gestão de resíduos aumentam: 3,2% anualmente para serviços residenciais, 4,1% para serviços comerciais.
| Tipo de serviço | Aumento anual de preços | Taxa de retenção de clientes |
|---|---|---|
| residencial | 3.2% | 87% |
| Comercial | 4.1% | 82% |
Demanda de gerenciamento de resíduos sustentável
Tamanho do mercado para soluções sustentáveis de gerenciamento de resíduos: US $ 62,3 bilhões em 2023, projetados para atingir US $ 94,5 bilhões até 2028.
- Volume de reciclagem: 32,1 milhões de toneladas processadas em 2023
- Geração de energia renovável a partir de resíduos: 3,2 milhões de mwh
Waste Management, Inc. (WM) - As cinco forças de Porter: rivalidade competitiva
Paisagem dos principais concorrentes
A partir de 2024, o setor de gerenciamento de resíduos apresenta concorrentes -chave, incluindo:
| Concorrente | Quota de mercado | Receita anual |
|---|---|---|
| Serviços da República | 18.3% | US $ 14,2 bilhões |
| Waste Management, Inc. | 21.7% | US $ 19,7 bilhões |
| Veolia | 12.5% | US $ 11,3 bilhões |
Tendências de consolidação da indústria
Métricas de consolidação da indústria de gerenciamento de resíduos:
- Transações de fusões e aquisições em 2023: 37 ofertas concluídas
- Valor total da transação: US $ 4,6 bilhões
- Tamanho médio da oferta: US $ 124,3 milhões
Concorrência do mercado regional
| Região | Número de concorrentes locais | Concentração de mercado |
|---|---|---|
| Nordeste dos EUA | 14 | Alto |
| Centro -Oeste dos EUA | 22 | Moderado |
| Costa Oeste | 18 | Alto |
Requisitos de investimento de capital
Dados de investimento em infraestrutura para 2024:
- Despesas totais de capital da indústria: US $ 6,8 bilhões
- Investimento médio da empresa: US $ 412 milhões
- Gastes de infraestrutura de Waste Management, Inc.
Waste Management, Inc. (WM) - As cinco forças de Porter: ameaça de substitutos
Tecnologias emergentes de reciclagem e desperdício em energia
O tamanho do mercado global de desperdício em energia atingiu US $ 38,3 bilhões em 2022, projetado para crescer para US $ 54,6 bilhões até 2030, com um CAGR de 4,5%. A Waste Management, Inc. enfrenta a concorrência de tecnologias alternativas de processamento de resíduos.
| Tecnologia | Quota de mercado | Crescimento anual |
|---|---|---|
| Digestão anaeróbica | 22.7% | 5.2% |
| Incineração | 35.4% | 3.8% |
| Gaseificação | 12.6% | 6.1% |
Crescente economia circular e iniciativas de desperdício zero
O mercado de economia circulares deve atingir US $ 4,5 trilhões até 2030, apresentando uma ameaça de substituição significativa aos modelos tradicionais de gerenciamento de resíduos.
- Os compromissos corporativos de desperdício zero aumentou 42% em 2022
- A taxa de reciclagem global atingiu 19,1% em 2023
- Os investimentos em economia circular totalizaram US $ 338 bilhões em 2022
Tecnologias avançadas de processamento e classificação de resíduos
O mercado de classificação de resíduos movido a IA projetado para atingir US $ 2,3 bilhões até 2027, com 8,7% de CAGR. As tecnologias de classificação automatizadas reduzem os custos operacionais em 35% em comparação com os métodos tradicionais.
| Tecnologia | Redução de custos | Melhoria de eficiência |
|---|---|---|
| Sistemas de classificação de IA | 35% | 62% |
| Classificação robótica | 28% | 55% |
Regulamentos ambientais crescentes promovendo soluções alternativas de resíduos
Regulamentos ambientais globais que impulsionam alternativas de gerenciamento de resíduos. Os mecanismos de preços de carbono que se esperavam cobrir 23% das emissões globais até 2025.
- Políticas de economia circular da UE direcionadas à taxa de reciclagem de 65% até 2030
- Estados Unidos implementando mandatos mais rígidos de redução de resíduos
- A proibição da China de importações de resíduos plásticos que afetam estratégias globais de gerenciamento de resíduos
Waste Management, Inc. (WM) - As cinco forças de Porter: ameaça de novos participantes
Altos requisitos de capital inicial
A Waste Management, Inc. exigiu US $ 8,93 bilhões em despesas totais de capital para 2022. Os custos de desenvolvimento do aterro variam de US $ 500.000 a US $ 4,5 milhões por acre. Os custos de caminhão de coleta de resíduos têm em média US $ 250.000 por veículo.
| Categoria de investimento de capital | Custo aproximado |
|---|---|
| Desenvolvimento de aterros sanitários | US $ 500.000 - US $ 4,5 milhões por acre |
| Caminhão de coleta de lixo | US $ 250.000 por veículo |
| Instalação de processamento de resíduos | US $ 10 milhões - US $ 50 milhões |
Barreiras regulatórias ambientais
A EPA relatou 3.091 instalações de gerenciamento de resíduos ativos em 2022. O processo de permissão requer aproximadamente 18 a 36 meses para aprovação completa.
- Custos de conformidade ambiental: US $ 2,3 milhões por instalação
- Despesas de conformidade regulatória da EPA: US $ 500.000 - US $ 1,2 milhão anualmente
- Taxa de solicitação de licença de resíduos perigosos: US $ 50.000 - US $ 250.000
Economias de escala
A Waste Management, Inc. controlou 21,4% do mercado de gerenciamento de resíduos dos EUA em 2022, com receita anual de US $ 19,74 bilhões.
| Métrica de participação de mercado | Valor |
|---|---|
| Tamanho total do mercado | US $ 92,3 bilhões |
| Participação de mercado da WM | 21.4% |
| Receita anual | US $ 19,74 bilhões |
Logística de descarte de resíduos
A eficiência média da rota de coleta de resíduos requer US $ 0,87 por custo operacional. O gerenciamento de resíduos opera 261 aterros ativos e 5 instalações de resíduos em energia.
Barreiras de entrada do mercado regulatório
O gerenciamento de resíduos em nível estadual permite que o custo entre US $ 75.000 e US $ 350.000. Os regulamentos municipais de resíduos sólidos requerem protocolos complexos de conformidade.
- Estado de permissão de solicitação de processamento de tempo: 9-24 meses
- Investimento inicial de conformidade regulatória: US $ 1,5 milhão - US $ 3,2 milhões
- Custos anuais de manutenção regulatória: US $ 250.000 - US $ 750.000
Waste Management, Inc. (WM) - Porter's Five Forces: Competitive rivalry
You're analyzing the competitive landscape for Waste Management, Inc. (WM), and the rivalry force is definitely showing up in the numbers. Honestly, the competition here is fierce, driven by a few massive national players who are constantly jockeying for position alongside WM. We're talking about Republic Services, Inc. and Waste Connections, Inc. being the most visible national rivals, but the real heat often comes from the local and regional operators.
Waste Management, Inc. still holds the crown as the market leader, claiming an approximate 22.25% market share as of Q4 2024. That leadership position gives them scale, but it also makes them a target. The overall U.S. waste and recycling industry hit an estimated $104.63 billion in revenue in 2024, so even a small percentage point shift means billions of dollars in play.
The fragmentation in local and regional markets is what keeps the pressure on pricing. While the public giants dominate disposal, private companies still control a significant chunk-about 18.3% of the market in 2024, translating to just over $20 billion in revenue. This means that in many smaller territories, you're fighting smaller, more agile competitors who might not have the same overhead structure. It's a constant balancing act between leveraging scale and winning local bids.
Here's a quick look at how Waste Management, Inc. performed in its core business during the most recent reporting period, which shows how they are managing this rivalry:
| Metric | Value | Period | Source Context |
|---|---|---|---|
| Core Price Increase | 6.0% | Q3 2025 | Collection & Disposal segment pricing discipline. |
| Recycling Automation Investment | $128 million | Q1 2025 | Capital deployed into sustainability growth platforms. |
| Collection & Disposal Operating Margin (Adjusted) | 38.4% | Q3 2025 | Record margin achieved in the core business. |
| Total Industry Revenue (Estimated) | $104.63 billion | 2024 | Total U.S. waste and recycling industry revenue. |
Despite the intense rivalry, Waste Management, Inc.'s pricing discipline is evident. For instance, the Q3 2025 core price increase landed at 6.0%, which is crucial because it helped maintain a positive price-cost spread. That ability to pass through costs and gain a little extra is the bedrock of this business model when competitors are aggressive.
Competition isn't just about the price tag on the dumpster, though. Waste Management, Inc. is fueling non-price competition through massive capital deployment into future-proofing its operations. You see this clearly in their sustainability push. Specifically, they invested $128 million in recycling automation projects in Q1 2025 alone. This investment drives down labor costs-automation can decrease labor required per ton by up to 35%-and improves the quality and profitability of recycled materials, creating a differentiated offering that rivals struggle to match without similar infrastructure spending.
The competitive dynamics are shaped by these strategic investments:
- Automated recycling facilities deliver nearly double the operating EBITDA margin compared to non-automated ones.
- The company is on track to increase annual recycling capacity by 1.8 million tons by 2027 through these projects.
- WM has pledged almost $3 billion to sustainability efforts by 2026.
Finance: draft 13-week cash view by Friday.
Waste Management, Inc. (WM) - Porter's Five Forces: Threat of substitutes
The threat of substitutes for Waste Management, Inc. (WM) core business-traditional collection and disposal-is generally considered low in the near term. Waste collection and disposal remain essential, legally mandated services across the municipalities and commercial sectors WM serves. You can't simply stop producing waste, and regulations heavily favor formal, permitted disposal methods over informal ones. Still, the long-term landscape is shifting due to technological and economic evolution.
The most significant long-term substitute pressure comes from the accelerating transition toward a circular economy. This model fundamentally aims to eliminate waste by keeping resources in use for as long as possible. Projections show this shift is massive; the global circular economy is projected to reach a market value of $4.5 trillion by 2030. This growth signals a structural reduction in the volume of material that will ultimately require traditional landfilling or incineration, which are WM's primary revenue drivers.
More immediate, partial substitutes are emerging in the form of advanced recycling and waste-to-energy (WTE) technologies. These processes offer alternatives to landfilling by recovering value from waste streams. The combined market for these advanced solutions is projected to grow significantly, reaching a market size of $54.6 billion by 2030. This represents a direct competitive space where Waste Management, Inc. (WM) must compete or participate.
Waste Management, Inc. (WM) is actively mitigating this threat by positioning itself as a provider of these very alternatives, effectively turning a potential substitute into a new revenue stream. The company is heavily investing in sustainability growth projects, including renewable natural gas (RNG) facilities and advanced recycling centers. For instance, the company's renewable energy segment showed strong performance, with Q1 2025 renewable energy revenue reported at $92 million. This strategic pivot is crucial; the company is not just waiting for the market to change, it's driving the change within its own operations.
The demand for these non-landfill solutions is being externally reinforced by corporate mandates. You see this trend everywhere: companies are setting aggressive environmental, social, and governance (ESG) goals. The momentum behind zero-waste-to-landfill initiatives is gaining traction in 2025 as organizations strive to eliminate waste sent to landfills to support cleaner environments and meet regulatory demands. This corporate focus directly increases demand for Waste Management, Inc. (WM)'s recycling, composting, and energy recovery services, which are key components of a circular economy strategy.
Here is a quick look at the scale of the evolving landscape:
| Market Segment | Projected Value by 2030 | Source of Pressure/Opportunity |
|---|---|---|
| Circular Economy | $4.5 trillion | Long-term structural shift away from linear disposal. |
| Advanced Recycling & WTE Technologies | $54.6 billion | Direct partial substitute for landfilling/disposal services. |
| Waste Management, Inc. Renewable Energy Revenue (Q1 2025) | $92 million | WM's direct participation/mitigation in the substitute space. |
The key takeaway for you is that while the immediate threat from substitutes is low due to service necessity, the potential for substitution is high and growing rapidly. Waste Management, Inc. (WM) is addressing this by embedding itself in the substitute market, as evidenced by its renewable energy revenue performance in Q1 2025. The company's success hinges on its ability to scale these sustainability platforms faster than the overall volume of traditional waste declines.
Waste Management, Inc. (WM) - Porter's Five Forces: Threat of new entrants
Threat is low due to massive capital requirements for infrastructure and fleet.
WM operates an unreplicable network of 262 active landfills and 506 transfer stations.
Extensive regulatory hurdles and permitting for new disposal sites create a high barrier.
Established long-term municipal contracts make it hard for newcomers to gain initial volume.
New entrants cannot match WM's economies of scale across its North American footprint.
The capital-intensive nature of advanced waste management infrastructure presents a significant barrier for the U.S. waste reduction market, requiring substantial upfront investment in state-of-the-art recycling centers, waste-to-energy plants, and advanced sorting systems.
Consider the scale of investment Waste Management, Inc. is making just to maintain and grow its existing platforms:
| Metric | 2024 Actual (USD) | H1 2025 Actual (USD) | 2025 Projection/Guidance (USD) |
|---|---|---|---|
| Capital Expenditures (Total) | $3,231 million | $1.56 billion | N/A |
| Recycling Capital Investments (Planned) | N/A | N/A | $45 million (for 2025) |
| Total Recycling Investment (2022-2025) | N/A | N/A | Just over $1 billion |
| Total Assets (as of Q1 2025) | N/A | $44,486 million | N/A |
The sheer financial outlay required to replicate even a fraction of this asset base immediately deters most potential entrants. Furthermore, the operational scale achieved by Waste Management, Inc. translates directly into cost advantages that new players cannot immediately access.
The established operational performance demonstrates this scale advantage:
- Collection and Disposal operating EBITDA margin (Q2 2025): 37.9%
- WM Legacy Business operating EBITDA margin (H1 2025): 31.3%
- Expected 2025 Full Year Free Cash Flow Guidance: $2.8 billion to $2.9 billion
- Customer churn rate: Below 10%
Securing the necessary permits for new disposal sites is a multi-year, politically charged process, creating a significant regulatory moat. New entrants must also possess a specialized fleet of trucks to even qualify for competitive municipal trash collection contracts. Waste Management, Inc.'s ability to consistently deliver on long-term service agreements, supported by its financial strength-evidenced by a 10% dividend increase in 2025-reinforces customer loyalty and contract longevity, further solidifying the high barrier to entry for any new competitor seeking initial volume.
Disclaimer
All information, articles, and product details provided on this website are for general informational and educational purposes only. We do not claim any ownership over, nor do we intend to infringe upon, any trademarks, copyrights, logos, brand names, or other intellectual property mentioned or depicted on this site. Such intellectual property remains the property of its respective owners, and any references here are made solely for identification or informational purposes, without implying any affiliation, endorsement, or partnership.
We make no representations or warranties, express or implied, regarding the accuracy, completeness, or suitability of any content or products presented. Nothing on this website should be construed as legal, tax, investment, financial, medical, or other professional advice. In addition, no part of this site—including articles or product references—constitutes a solicitation, recommendation, endorsement, advertisement, or offer to buy or sell any securities, franchises, or other financial instruments, particularly in jurisdictions where such activity would be unlawful.
All content is of a general nature and may not address the specific circumstances of any individual or entity. It is not a substitute for professional advice or services. Any actions you take based on the information provided here are strictly at your own risk. You accept full responsibility for any decisions or outcomes arising from your use of this website and agree to release us from any liability in connection with your use of, or reliance upon, the content or products found herein.