
|
A Williams Companies, Inc. (WMB) DCF Avaliação |
Totalmente Editável: Adapte-Se Às Suas Necessidades No Excel Ou Planilhas
Design Profissional: Modelos Confiáveis E Padrão Da Indústria
Pré-Construídos Para Uso Rápido E Eficiente
Compatível com MAC/PC, totalmente desbloqueado
Não É Necessária Experiência; Fácil De Seguir
The Williams Companies, Inc. (WMB) Bundle
Explore as perspectivas financeiras da Williams Companies, Inc. (WMB) com nossa calculadora DCF amigável! Digite suas projeções de crescimento, margens e despesas para calcular o valor intrínseco da Williams Companies, Inc. (WMB) e informar suas decisões de investimento.
What You Will Get
- Editable Excel Template: A fully customizable Excel-based DCF Calculator featuring pre-filled real WMB financials.
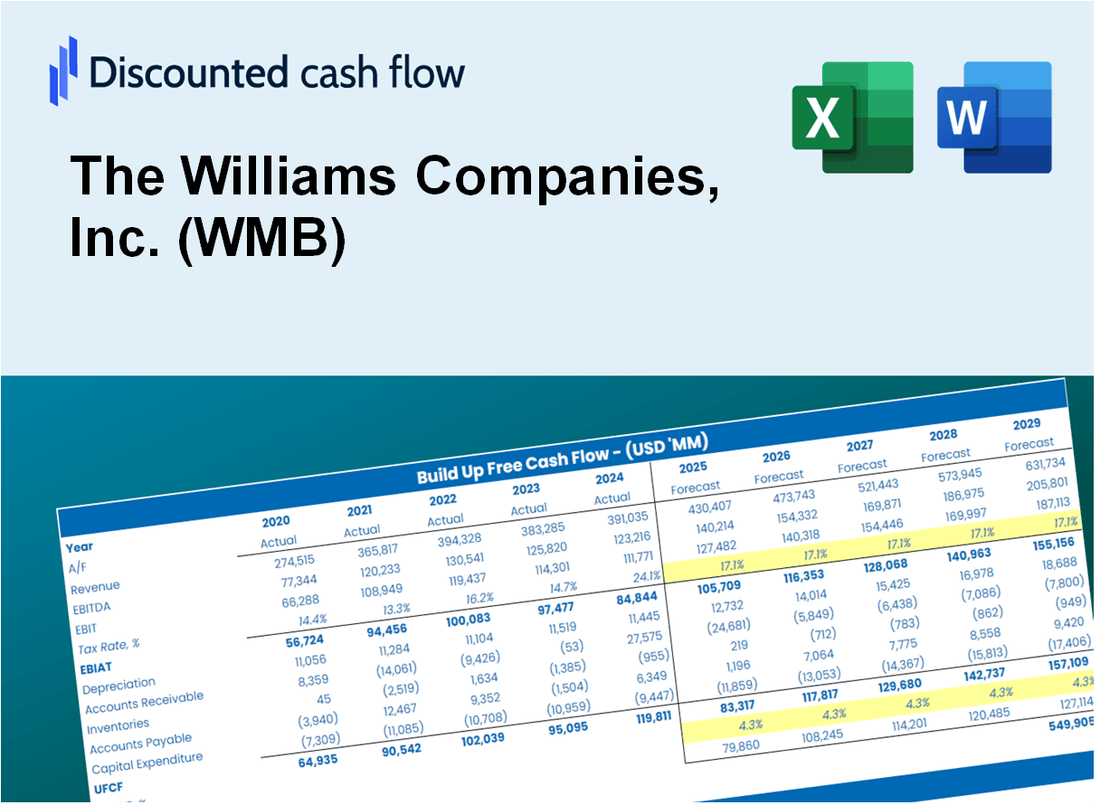
- Real-World Data: Historical data and forward-looking estimates (as indicated in the yellow cells).
- Forecast Flexibility: Adjust forecast assumptions such as revenue growth, EBITDA %, and WACC.
- Automatic Calculations: Quickly see how your inputs affect the valuation of The Williams Companies, Inc. (WMB).
- Professional Tool: Designed for investors, CFOs, consultants, and financial analysts.
- User-Friendly Design: Organized for clarity and ease of use, complete with step-by-step instructions.
Key Features
- Comprehensive WMB Data: Pre-loaded with The Williams Companies' historical performance and future forecasts.
- Customizable Parameters: Modify revenue growth rates, profit margins, discount rates, tax implications, and capital investments.
- Interactive Valuation Model: Real-time updates to Net Present Value (NPV) and intrinsic value based on your custom inputs.
- Scenario Analysis: Develop various forecasting scenarios to evaluate different valuation possibilities.
- User-Centric Interface: Intuitive, organized, and suitable for both industry experts and newcomers.
How It Works
- Download: Access the ready-to-use Excel file with The Williams Companies, Inc. (WMB) financial data.
- Customize: Adjust forecasts, including revenue growth, EBITDA %, and WACC for The Williams Companies, Inc. (WMB).
- Update Automatically: The intrinsic value and NPV calculations for The Williams Companies, Inc. (WMB) update in real-time.
- Test Scenarios: Create multiple projections for The Williams Companies, Inc. (WMB) and compare outcomes instantly.
- Make Decisions: Use the valuation results of The Williams Companies, Inc. (WMB) to guide your investment strategy.
Why Choose This Calculator for The Williams Companies, Inc. (WMB)?
- Comprehensive Tool: Offers DCF, WACC, and financial ratio analyses all in one platform.
- Customizable Inputs: Modify yellow-highlighted cells to explore different scenarios.
- Detailed Insights: Automatically computes The Williams Companies' intrinsic value and Net Present Value.
- Preloaded Data: Historical and projected data provide reliable starting points for analysis.
- Professional Quality: Perfect for financial analysts, investors, and business consultants focused on (WMB).
Who Should Use This Product?
- Investors: Accurately estimate The Williams Companies, Inc.’s fair value before making investment decisions.
- CFOs: Utilize a professional-grade DCF model for financial reporting and analysis specific to WMB.
- Consultants: Quickly customize the template for valuation reports tailored to clients of The Williams Companies, Inc.
- Entrepreneurs: Gain insights into the financial modeling practices employed by leading firms in the energy sector.
- Educators: Use it as a teaching resource to illustrate valuation methodologies in the context of WMB.
What the Template Contains
- Historical Data: Includes The Williams Companies, Inc. (WMB)’s past financials and baseline forecasts.
- DCF and Levered DCF Models: Detailed templates to calculate The Williams Companies, Inc. (WMB)’s intrinsic value.
- WACC Sheet: Pre-built calculations for Weighted Average Cost of Capital.
- Editable Inputs: Modify key drivers like growth rates, EBITDA %, and CAPEX assumptions.
- Quarterly and Annual Statements: A complete breakdown of The Williams Companies, Inc. (WMB)’s financials.
- Interactive Dashboard: Visualize valuation results and projections dynamically.
Disclaimer
All information, articles, and product details provided on this website are for general informational and educational purposes only. We do not claim any ownership over, nor do we intend to infringe upon, any trademarks, copyrights, logos, brand names, or other intellectual property mentioned or depicted on this site. Such intellectual property remains the property of its respective owners, and any references here are made solely for identification or informational purposes, without implying any affiliation, endorsement, or partnership.
We make no representations or warranties, express or implied, regarding the accuracy, completeness, or suitability of any content or products presented. Nothing on this website should be construed as legal, tax, investment, financial, medical, or other professional advice. In addition, no part of this site—including articles or product references—constitutes a solicitation, recommendation, endorsement, advertisement, or offer to buy or sell any securities, franchises, or other financial instruments, particularly in jurisdictions where such activity would be unlawful.
All content is of a general nature and may not address the specific circumstances of any individual or entity. It is not a substitute for professional advice or services. Any actions you take based on the information provided here are strictly at your own risk. You accept full responsibility for any decisions or outcomes arising from your use of this website and agree to release us from any liability in connection with your use of, or reliance upon, the content or products found herein.