
|
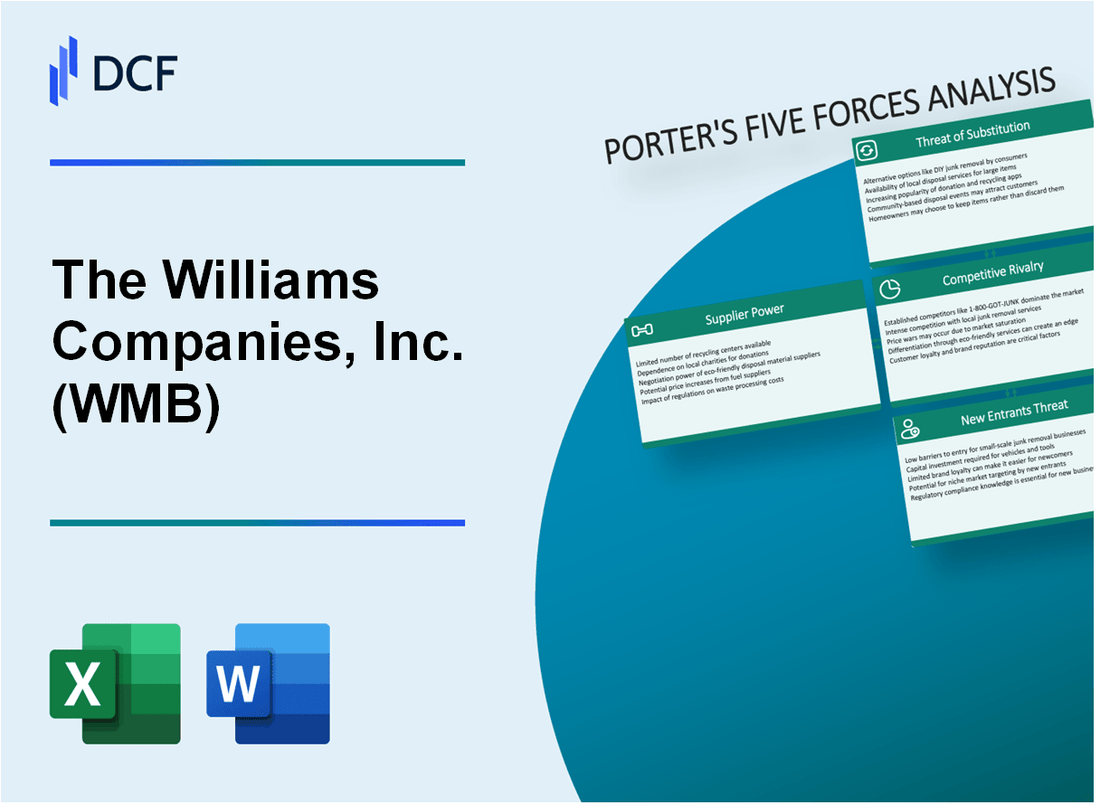
The Williams Companies, Inc. (WMB): 5 forças Análise [Jan-2025 Atualizada] |
Totalmente Editável: Adapte-Se Às Suas Necessidades No Excel Ou Planilhas
Design Profissional: Modelos Confiáveis E Padrão Da Indústria
Pré-Construídos Para Uso Rápido E Eficiente
Compatível com MAC/PC, totalmente desbloqueado
Não É Necessária Experiência; Fácil De Seguir
The Williams Companies, Inc. (WMB) Bundle
No cenário dinâmico da infraestrutura energética do meio da corrente, a Williams Companies, Inc. (WMB) navega em uma complexa rede de forças de mercado que moldam seu posicionamento estratégico. Como participante -chave do transporte de gás natural e NGL, a Williams enfrenta um ambiente competitivo multifacetado, onde as relações de fornecedores, dinâmica do cliente, rivalidades de mercado, interrupções tecnológicas e novos participantes em potencial remodelam constantemente o terreno competitivo do setor. Esse mergulho profundo na estrutura das cinco forças de Porter revela os intrincados desafios e oportunidades que definem a estratégia de negócios de Williams em 2024, oferecendo informações sobre como a empresa mantém sua vantagem competitiva em um ecossistema energético cada vez mais transformador.
The Williams Companies, Inc. (WMB) - As cinco forças de Porter: poder de barganha dos fornecedores
Número limitado de grandes empresas de produção de gás natural e NGL
A partir de 2024, o cenário da produção de gás natural dos EUA está concentrado entre os principais players:
| Empresa | Produção de gás natural (BCF/dia) | Quota de mercado |
|---|---|---|
| ExxonMobil | 5.4 | 12.3% |
| Chevron | 4.8 | 10.9% |
| ConocoPhillips | 4.2 | 9.5% |
| Concha | 3.9 | 8.9% |
Contratos de fornecimento de longo prazo com os principais produtores
Williams garantiu acordos de fornecimento de longo prazo com os principais produtores:
- Duração média do contrato: 10-15 anos
- Mecanismos de preços fixos em 68% dos contratos
- Compromissos de volume mínimo que variam de 250-500 mmcf/dia
Investimentos de infraestrutura, reduzindo os custos de troca de fornecedores
Williams Infrastructure Investments a partir de 2024:
| Tipo de ativo | Investimento total | Capacidade |
|---|---|---|
| Sistemas de coleta | US $ 3,2 bilhões | 4.5 BCF/dia |
| Plantas de processamento | US $ 2,7 bilhões | 3.2 BCF/dia |
| Oleodutos de transporte | US $ 4,5 bilhões | 6.8 BCF/dia |
Integração vertical através de ativos médios
Detalhes do portfólio de ativos de Williams Midstream:
- Propriedade em 15 principais instalações de processamento de gás natural
- Controle de 30.000 milhas de oleodutos interestaduais e intra -estabelecidos
- Capacidade de fracionamento da NGL: 550.000 barris por dia
The Williams Companies, Inc. (WMB) - As cinco forças de Porter: poder de barganha dos clientes
Composição da base de clientes
A Williams atende aproximadamente 3.300 clientes em setores de geração de energia, industrial e residencial a partir de 2023.
| Segmento de clientes | Porcentagem da receita total |
|---|---|
| Geração de energia | 42% |
| Clientes industriais | 33% |
| Setor residencial | 25% |
Alavancagem de negociação do cliente
Os grandes clientes de serviços públicos representam aproximadamente 65% do volume total de contratos da Williams, com poder de negociação moderado.
- Os 10 principais clientes representam 52% da receita anual
- Duração média do contrato: 7-10 anos
- Valor anual mínimo do contrato: US $ 50 milhões
Sensibilidade a preços e dinâmica de mercado
A sensibilidade ao preço varia entre os segmentos de mercado, com clientes industriais mostrando uma elasticidade de preço 18% mais alta em comparação com clientes residenciais.
| Segmento de mercado | Elasticidade do preço | Valor médio anual do contrato |
|---|---|---|
| Geração de energia | 0.65 | US $ 75 milhões |
| Industrial | 0.85 | US $ 45 milhões |
| residencial | 0.45 | US $ 15 milhões |
Acordos de longo prazo impacto
Os contratos de transporte e armazenamento de longo prazo reduzem a probabilidade de troca de clientes em aproximadamente 72%.
- Período médio de bloqueio de contrato: 8,3 anos
- Pena de rescisão antecipada: 15-25% do valor do contrato restante
- Taxa de renovação: 88% para contratos de longo prazo existentes
The Williams Companies, Inc. (WMB) - As cinco forças de Porter: rivalidade competitiva
Concorrência intensa na infraestrutura energética do meio -fluxo
A partir de 2024, as empresas da Williams enfrentam pressão competitiva significativa no setor de infraestrutura de energia médio. A empresa compete com 11 principais empresas de infraestrutura de energia no meio dos Estados Unidos.
| Concorrente | Capitalização de mercado | Miles totais de pipeline |
|---|---|---|
| Enterprise Products Partners | US $ 62,3 bilhões | 50.000 milhas |
| Morgan mais gentil | US $ 42,7 bilhões | 70.000 milhas |
| Empresas de Williams | US $ 38,5 bilhões | 33.000 milhas |
Concentração regional do mercado
A Williams Companies concentrou operações nas principais bacias de gás natural:
- Marcellus Shale: 3,9 bilhões de pés cúbicos por dia
- Xisto Utica: 2,1 bilhões de pés cúbicos por dia
- Haynesville Shale: 1,5 bilhão de pés cúbicos por dia
Cenário competitivo
O posicionamento competitivo da empresa inclui:
- Rede de pipeline: 33.000 milhas de oleodutos interestaduais de transmissão de gás natural
- Avaliação de ativos: US $ 45,2 bilhões em ativos totais de infraestrutura intermediária
- Quota de mercado: 12,4% do mercado de transmissão de gás natural dos EUA
A Williams Companies, Inc. (WMB) - Five Forces de Porter: ameaça de substitutos
Aumentando alternativas de energia renovável
A partir de 2023, a capacidade de energia renovável atingiu 295 GW nos Estados Unidos. As instalações solares aumentaram para 20,2 GW em 2022, representando um crescimento de 21% ano a ano. A capacidade de energia eólica atingiu 141,8 GW em 2022, com US $ 12,8 bilhões investidos em novos projetos eólicos.
| Tipo de energia renovável | 2022 Capacidade (GW) | Investimento ($ b) |
|---|---|---|
| Solar | 20.2 | 9.6 |
| Vento | 141.8 | 12.8 |
Eletrificação crescente em transporte e geração de energia
As vendas de veículos elétricos atingiram 807.180 unidades em 2022, representando 5,8% do total de vendas de veículos dos EUA. A participação de mercado de veículos elétricos da bateria aumentou para 5,8% em 2022, com crescimento projetado para 25% até 2025.
- Vendas de veículos elétricos: 807.180 unidades em 2022
- Participação de mercado de EV: 5,8%
- Participação de mercado EV projetada até 2025: 25%
Gás natural como combustível de transição
O gás natural compreendeu 38,3% da geração de eletricidade dos EUA em 2022. As emissões de carbono de gás natural são de aproximadamente 0,91 libras de CO2 por kWh, em comparação com 2,23 libras para carvão.
| Fonte de energia | Geração de eletricidade (%) | Emissões de CO2 (lbs/kWh) |
|---|---|---|
| Gás natural | 38.3 | 0.91 |
| Carvão | 19.5 | 2.23 |
Avanços tecnológicos em armazenamento de energia
As implantações globais de armazenamento de energia atingiram 42,1 GWh em 2022, com os custos da bateria de íons de lítio diminuindo para US $ 132 por kWh. Espera -se que a capacidade de armazenamento de energia projetada atinja 358 GWh até 2030.
- Implantação global de armazenamento de energia: 42,1 gwh em 2022
- Custo da bateria de íons de lítio: US $ 132 por kWh
- Capacidade projetada de armazenamento de energia até 2030: 358 GWh
The Williams Companies, Inc. (WMB) - As cinco forças de Porter: ameaça de novos participantes
Requisitos de capital alto para infraestrutura média
As empresas da Williams exigem aproximadamente US $ 1,4 bilhão em despesas anuais de capital para o desenvolvimento da infraestrutura média do meio do 2023. Os custos iniciais de construção de dutos variam de US $ 1,5 milhão a US $ 2,5 milhões por milha, dependendo do terreno e das especificações.
| Tipo de infraestrutura | Investimento de capital estimado |
|---|---|
| Oleodutos de gás natural | US $ 750 milhões - US $ 1,2 bilhão |
| Instalações de processamento | US $ 500 milhões - US $ 850 milhões |
| Estações de compressão | US $ 150 milhões - US $ 300 milhões |
Ambiente regulatório complexo
O processo de aprovação da FERC (Federal Energy Regulatory Commission) normalmente leva de 12 a 18 meses para novos projetos de infraestrutura do meio do meio. Os custos de conformidade podem exceder US $ 50 milhões para aprovações regulatórias abrangentes.
Requisitos iniciais de investimento significativos
- Construção da rede de gasodutos de gás natural: US $ 2,1 bilhões em 2022
- Expansão da instalação de processamento: US $ 675 milhões em 2023
- Aquisição de passagem: US $ 85-120 milhões anualmente
Barreiras de posicionamento de mercado
Williams controla aproximadamente 15.700 milhas de gasodutos interestaduais de transmissão de gás natural. A participação de mercado em regiões -chave como Marcellus e Utica Shales excede 40% da infraestrutura regional do meio -fluxo.
Economias de vantagens em escala
| Métrica de escala | Williams Companies Performance |
|---|---|
| Receita anual | US $ 9,5 bilhões (2022) |
| Eficiência de custo operacional | 23% menor que a média da indústria |
| Utilização de infraestrutura | 87% de otimização da capacidade |
The Williams Companies, Inc. (WMB) - Porter's Five Forces: Competitive rivalry
You're looking at the competitive rivalry force for The Williams Companies, Inc. (WMB), and honestly, it's a heavyweight bout in the midstream energy sector. This isn't a market where a small player can easily sneak in; you're dealing with established giants who have massive, integrated footprints. The rivalry is intense because the core business-moving natural gas via pipelines-is capital-intensive and relies on securing long-term, fee-based contracts. If you don't have scale, you struggle to compete on efficiency and project execution.
The Williams Companies, Inc. operates a 33,000-mile pipeline network, moving about a third of the country's natural gas. Still, that market share is heavily contested across the key basins where WMB has assets, like the Permian, Marcellus, and Haynesville Shales. Kinder Morgan, for instance, is a direct and formidable rival, transporting roughly 40% of U.S. natural gas production. The contestation isn't just about volume; it's about securing the next wave of demand from LNG exports and power generation, where WMB is actively pursuing projects.
Here's a quick look at how The Williams Companies, Inc. stacks up against one of its largest rivals based on recent figures:
| Metric (as of mid-2025) | The Williams Companies, Inc. (WMB) | Kinder Morgan (KMI) |
|---|---|---|
| TTM Adjusted EBITDA (Q2 2025) | $7.276 billion | $8.072 billion |
| Contracted Transmission Capacity (Approximate) | 34.3 BCF/D (as of Q1 2025) | Transports roughly 40% of U.S. gas production |
| Debt-to-Adjusted EBITDA Ratio (Approximate) | 3.93x (as of June 30, 2025) | Targeting 3.8x by end of 2025 |
| Dividend Yield (Approximate) | 3.4% (as of mid-2025) | 4.1% (as of mid-2025) |
The structure of the midstream industry itself drives rivalry pressure. The sector is 'famously expensive to operate and tightly regulated,' meaning high fixed costs are a given. While The Williams Companies, Inc. benefits from long-term, take-or-pay contracts that stabilize cash flow, any regional gathering and processing markets suffering from excess capacity-perhaps due to shifting production patterns or project overbuilds-will definitely see margin compression. The Williams Companies, Inc. posted strong operating margins at 32.6%, which is well above the industry average of 17.9%, but that doesn't eliminate the underlying risk inherent in high fixed-cost infrastructure.
Furthermore, the competitive landscape is constantly being reshaped by consolidation, which creates fewer, but much larger and more formidable, rivals. You saw this clearly with ONEOK's aggressive moves. ONEOK completed its acquisition of a controlling interest in EnLink Midstream on January 31, 2025, for a total cash consideration of approximately $3.3 billion for the initial stake. This deal, combined with ONEOK's acquisition of Medallion Midstream, is intended to build a powerhouse in the Permian Basin. These large-scale mergers mean The Williams Companies, Inc. must compete against entities with even greater scale and synergy potential, aiming for annual synergies between $250 million to $450 million within three years from the EnLink integration alone.
The actions of these competitors highlight the competitive pressure you need to watch:
- Kinder Morgan's project backlog reached $9.3 billion by Q2 2025.
- ONEOK is targeting a Net Debt-to-Adjusted EBITDA ratio of 3.5x by 2026.
- Enterprise Products Partners' dividend yield was around 6.9% in mid-2025, significantly higher than WMB's 3.4%.
- The Williams Companies, Inc. plans 2025 growth capital expenditures in the range of $2.575 billion to $2.875 billion to keep pace.
Finance: draft 13-week cash view by Friday.
The Williams Companies, Inc. (WMB) - Porter's Five Forces: Threat of substitutes
You're looking at how The Williams Companies, Inc. (WMB) might be replaced by alternative energy sources, which is a key part of understanding the long-term risk profile here. Honestly, for now, natural gas remains firmly positioned as a critical transition fuel and a necessary reliable backup for the intermittent nature of renewables.
The Williams Companies, Inc. moved a substantial amount of gas in the middle of 2025. To put that in perspective, The Williams Companies transported an average of 14.6 million dekatherms of natural gas per day through its infrastructure in the second quarter of 2025, which is roughly 14.6 billion cubic feet per day. This volume underpins the electricity generation that keeps the grid stable when the sun isn't shining or the wind isn't blowing. The company is banking on this structural demand, projecting an adjusted EBITDA growth rate of 5% to 7% through 2030, with its 2025 Adjusted EBITDA guidance midpoint set at $7.75 billion.
Still, the threat from renewables is real and accelerating, posing a long-term substitution risk. While the prompt notes U.S. renewable capacity reached 295 GW in 2023, the pace of new additions in 2025 clearly shows where the market is shifting its investment dollars. Developers planned for a record 64 GW of new utility-scale capacity in 2025. Solar power is leading this charge, expected to account for 33 GW of that total, which is more than half of all new capacity. Compare that to natural gas, which only accounts for 4.7 GW of planned additions for 2025.
| Metric | Value (2025 Data) | Context |
|---|---|---|
| WMB Avg. Daily Gas Transport (Q2 2025) | 14.6 million dekatherms/day | The Williams Companies Q2 2025 transport volume |
| Total New US Power Capacity Planned (2025) | 64 GW | EIA data for 2025 additions |
| New Solar Capacity Planned (2025) | 33 GW | EIA data for 2025 additions |
| New Natural Gas Capacity Planned (2025) | 4.7 GW | EIA data for 2025 additions |
| Battery Storage Capacity Added (Planned 2025) | 18.3 GW | EIA data for 2025 additions |
However, The Williams Companies, Inc. is actively offsetting substitution risk by capturing new, massive demand centers. The exponential rise in artificial intelligence is driving data centers to require immense amounts of reliable power. The company has committed a total of $5 billion to its 'power innovation' strategy to serve this need. Specifically, The Williams Companies, Inc. announced plans to invest about $3.1 billion in two new power projects for data centers, with one known project, Socrates, representing a $1.6 billion investment expected to generate $320 million in annual revenue. This move caused The Williams Companies, Inc. to raise its 2025 growth capital spending range to between $3.45 billion and $3.75 billion. Plus, rising activity from Liquefied Natural Gas (LNG) export facilities continues to strengthen the long-term demand for natural gas transport through its essential Transco pipeline system.
Looking further out, emerging technologies like hydrogen and Carbon Capture, Utilization, and Storage (CCUS) represent a potential long-term substitute, but they are not yet at a scale to meaningfully displace The Williams Companies, Inc.'s core business. As of November 2025, in the UK, no commercial-scale BECCS (Bioenergy with Carbon Capture and Storage) or DACCS (Direct Air Capture with $\text{CO}_2$ Storage) projects have reached commercial scale. Globally, operational $\text{CO}_2$ capture capacity reached about 50 million tons per year as of Q1 2025. Europe is starting to deploy CCS at commercial scale, with announced projects targeting about 4 million tons $\text{CO}_2$ per year of capture capacity. The high costs are a clear barrier; for instance, the world's largest DAC plant in Iceland reportedly had costs as high as $1,000 per tonne as of March 2025.
The current state of these alternatives suggests a slow transition, which benefits The Williams Companies, Inc.'s current asset base:
- CCUS operational capacity is around 50 million tons $\text{CO}_2$/year (Q1 2025).
- New European commercial CCS projects target 4 million tons $\text{CO}_2$/year capture.
- The largest DAC plant costs were near $1,000 per tonne (March 2025).
- No BECCS or DACCS projects in the UK have reached commercial scale (November 2025).
The Williams Companies, Inc. is focused on securing 10-year, primarily fixed-price power purchase agreements for its data center projects, which provides revenue certainty well into the next decade.
The Williams Companies, Inc. (WMB) - Porter's Five Forces: Threat of new entrants
The threat of new entrants for The Williams Companies, Inc. in the interstate natural gas transmission business remains exceptionally low, primarily due to the massive upfront capital investment required to even consider competing. You're looking at costs that dwarf most other infrastructure plays. New pipeline construction is not a small undertaking; recent data shows that while pipelines built before 2024 averaged about \$5.75 million per mile, projects proposed or completed since 2024 have seen cost per mile jump by almost 90% relative to that average. To put this into perspective with a specific, high-cost example, the Transco Atlantic Sunrise project reached \$13 million per mile. The Williams Companies, Inc. itself is guiding 2025 growth Capital Expenditures (Capex) between \$2.575 billion and \$2.875 billion, illustrating the scale of investment incumbents deploy just for expansion, let alone greenfield entry.
The sheer financial hurdle is compounded by the regulatory gauntlet. Extensive and lengthy federal and state regulatory permitting processes create a formidable barrier that can take years to navigate, even with recent administrative tailwinds. For instance, while the Federal Energy Regulatory Commission (FERC) issued a one-year temporary waiver in June 2025 to allow construction to proceed pending rehearing requests (waiving the prohibition under Order No. 871 until June 30, 2026), this is a temporary measure. Furthermore, state-level permit denials, such as those seen previously for the Northeast Supply Enhancement Project (NESE) despite broad market support, show that state agencies can still halt progress.
Incumbents like The Williams Companies, Inc. benefit from significant, entrenched economies of scale and control over critical existing assets. The Williams Companies, Inc.'s Transco pipeline network traverses over 10,000 miles, and with recent expansions, its system-design capacity has increased to more than 20 Billion cubic feet per day (Bcf/day). This massive system moves approximately 20% of all the natural gas produced in the U.S.. As of the first quarter of 2025, The Williams Companies, Inc. reported a record contracted transmission capacity of 34.3 Bcf/d across its systems. Securing the rights-of-way and market access for a competing network of this magnitude is nearly impossible for a new entrant today.
New administration efforts are certainly attempting to lower the regulatory friction, but legal challenges remain a constant deterrent for any prospective competitor. The Pipeline & Hazardous Materials Safety Administration (PHMSA) proposed rule changes in July 2025 aimed at reducing costs and allowing new technology, such as using drones and satellites for pipeline right-of-way patrols. FERC is also seeking comments on permanent regulatory changes to expedite development. However, the need for new projects to satisfy market demand is often met by existing players expanding contracted capacity, as The Williams Companies, Inc. is doing with 12 high-return transmission projects currently in execution, set to add more than 3.25 Billion cubic feet per day to their systems.
Here's a quick look at the cost disparity that defines this barrier:
| Metric | Value/Range | Context/Source Year |
|---|---|---|
| Pre-2024 Average Pipeline Cost | \$5.75 million per mile | Average for pipelines built before 2024 |
| Recent High-End Project Cost | \$13 million per mile | Transco Atlantic Sunrise Project |
| Cost Increase Since 2024 (Approximate) | ~90% increase | Relative to the pre-2024 average |
| The Williams Companies, Inc. 2025 Growth Capex Guidance Midpoint | \$2.725 billion | Range of \$2.575B to \$2.875B |
| The Williams Companies, Inc. Transco System Capacity | More than 20 Bcf/day | System-design capacity as of April 2025 |
The barriers to entry are structural and financial, meaning potential competitors face:
- Massive, multi-billion dollar initial capital outlay.
- Years of regulatory uncertainty and permitting risk.
- The need to secure rights-of-way against incumbents.
- Competition against established scale of over 34.3 Bcf/d contracted capacity.
Disclaimer
All information, articles, and product details provided on this website are for general informational and educational purposes only. We do not claim any ownership over, nor do we intend to infringe upon, any trademarks, copyrights, logos, brand names, or other intellectual property mentioned or depicted on this site. Such intellectual property remains the property of its respective owners, and any references here are made solely for identification or informational purposes, without implying any affiliation, endorsement, or partnership.
We make no representations or warranties, express or implied, regarding the accuracy, completeness, or suitability of any content or products presented. Nothing on this website should be construed as legal, tax, investment, financial, medical, or other professional advice. In addition, no part of this site—including articles or product references—constitutes a solicitation, recommendation, endorsement, advertisement, or offer to buy or sell any securities, franchises, or other financial instruments, particularly in jurisdictions where such activity would be unlawful.
All content is of a general nature and may not address the specific circumstances of any individual or entity. It is not a substitute for professional advice or services. Any actions you take based on the information provided here are strictly at your own risk. You accept full responsibility for any decisions or outcomes arising from your use of this website and agree to release us from any liability in connection with your use of, or reliance upon, the content or products found herein.