
|
West Bancorporation, Inc. (WTBA) Avaliação DCF |
Totalmente Editável: Adapte-Se Às Suas Necessidades No Excel Ou Planilhas
Design Profissional: Modelos Confiáveis E Padrão Da Indústria
Pré-Construídos Para Uso Rápido E Eficiente
Compatível com MAC/PC, totalmente desbloqueado
Não É Necessária Experiência; Fácil De Seguir
West Bancorporation, Inc. (WTBA) Bundle
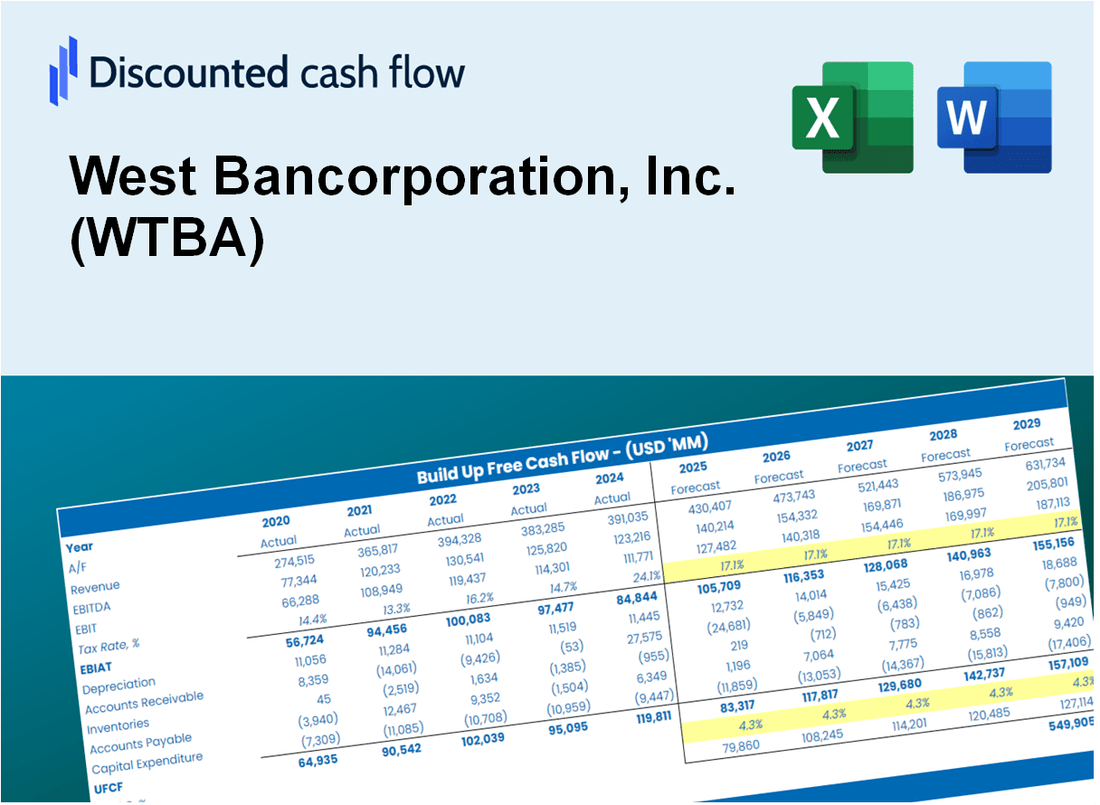
Projetado para precisão, nossa calculadora DCF (WTBA) permite avaliar a avaliação West Bancorporation, Inc. usando dados financeiros atuais, fornecendo toda a flexibilidade para modificar todos os parâmetros essenciais para projeções aprimoradas.
What You Will Get
- Real WTBA Financial Data: Pre-filled with West Bancorporation's historical and projected data for precise analysis.
- Fully Editable Template: Modify key inputs like revenue growth, WACC, and EBITDA % with ease.
- Automatic Calculations: See West Bancorporation’s intrinsic value update instantly based on your changes.
- Professional Valuation Tool: Designed for investors, analysts, and consultants seeking accurate DCF results.
- User-Friendly Design: Simple structure and clear instructions for all experience levels.
Key Features
- 🔍 Real-Life WTBA Financials: Pre-filled historical and projected data for West Bancorporation, Inc.
- ✏️ Fully Customizable Inputs: Adjust all critical parameters (yellow cells) such as WACC, growth %, and tax rates.
- 📊 Professional DCF Valuation: Built-in formulas calculate West Bancorporation’s intrinsic value using the Discounted Cash Flow method.
- ⚡ Instant Results: Visualize West Bancorporation’s valuation instantly after making changes.
- Scenario Analysis: Test and compare outcomes for various financial assumptions side-by-side.
How It Works
- 1. Access the Template: Download and open the Excel file featuring West Bancorporation, Inc.'s (WTBA) preloaded data.
- 2. Modify Assumptions: Adjust key parameters such as growth rates, WACC, and capital expenditures.
- 3. View Results Instantly: The DCF model automatically computes intrinsic value and NPV.
- 4. Explore Scenarios: Evaluate various forecasts to assess different valuation outcomes.
- 5. Present with Assurance: Deliver professional valuation insights to back your strategic decisions.
Why Choose This Calculator for West Bancorporation, Inc. (WTBA)?
- Accuracy: Utilizes real West Bancorporation financial data for precise calculations.
- Flexibility: Allows users to easily adjust and test various input parameters.
- Time-Saving: Eliminate the need to create a DCF model from the ground up.
- Professional-Grade: Crafted with the expertise and standards expected at the CFO level.
- User-Friendly: Intuitive design makes it accessible for users with varying levels of financial expertise.
Who Should Use This Product?
- Finance Students: Explore financial modeling techniques and apply them to real-world data with West Bancorporation, Inc. (WTBA).
- Academics: Integrate advanced valuation models into your research or teaching materials focused on West Bancorporation, Inc. (WTBA).
- Investors: Evaluate your investment strategies and analyze the financial performance of West Bancorporation, Inc. (WTBA).
- Analysts: Enhance your analysis process with a customizable financial model tailored for West Bancorporation, Inc. (WTBA).
- Small Business Owners: Understand the financial metrics used to assess companies like West Bancorporation, Inc. (WTBA).
What the Template Contains
- Preloaded WTBA Data: Historical and projected financial data, including revenue, EBIT, and capital expenditures.
- DCF and WACC Models: Professional-grade sheets for calculating intrinsic value and Weighted Average Cost of Capital.
- Editable Inputs: Yellow-highlighted cells for adjusting revenue growth, tax rates, and discount rates.
- Financial Statements: Comprehensive annual and quarterly financials for deeper analysis.
- Key Ratios: Profitability, leverage, and efficiency ratios to evaluate performance.
- Dashboard and Charts: Visual summaries of valuation outcomes and assumptions.
Disclaimer
All information, articles, and product details provided on this website are for general informational and educational purposes only. We do not claim any ownership over, nor do we intend to infringe upon, any trademarks, copyrights, logos, brand names, or other intellectual property mentioned or depicted on this site. Such intellectual property remains the property of its respective owners, and any references here are made solely for identification or informational purposes, without implying any affiliation, endorsement, or partnership.
We make no representations or warranties, express or implied, regarding the accuracy, completeness, or suitability of any content or products presented. Nothing on this website should be construed as legal, tax, investment, financial, medical, or other professional advice. In addition, no part of this site—including articles or product references—constitutes a solicitation, recommendation, endorsement, advertisement, or offer to buy or sell any securities, franchises, or other financial instruments, particularly in jurisdictions where such activity would be unlawful.
All content is of a general nature and may not address the specific circumstances of any individual or entity. It is not a substitute for professional advice or services. Any actions you take based on the information provided here are strictly at your own risk. You accept full responsibility for any decisions or outcomes arising from your use of this website and agree to release us from any liability in connection with your use of, or reliance upon, the content or products found herein.