
|
WW International, Inc. (WW) Avaliação DCF |
Totalmente Editável: Adapte-Se Às Suas Necessidades No Excel Ou Planilhas
Design Profissional: Modelos Confiáveis E Padrão Da Indústria
Pré-Construídos Para Uso Rápido E Eficiente
Compatível com MAC/PC, totalmente desbloqueado
Não É Necessária Experiência; Fácil De Seguir
WW International, Inc. (WW) Bundle
Procurando avaliar o valor intrínseco da WW International, Inc.? Nossa calculadora DCF WW (WW) integra dados do mundo real com extensos recursos de personalização, permitindo refinar suas previsões e aprimorar suas opções de investimento.
What You Will Get
- Editable Forecast Inputs: Easily modify assumptions (growth %, margins, WACC) to explore various scenarios.
- Real-World Data: WW International, Inc.'s (WW) financial data pre-filled to kickstart your analysis.
- Automatic DCF Outputs: The template computes Net Present Value (NPV) and intrinsic value automatically.
- Customizable and Professional: A refined Excel model that adjusts to your valuation requirements.
- Built for Analysts and Investors: Perfect for testing projections, validating strategies, and enhancing efficiency.
Key Features
- Comprehensive WW Data: Pre-filled with WW International, Inc.’s historical financials and future projections.
- Fully Customizable Inputs: Modify revenue growth, profit margins, WACC, tax rates, and capital expenditures as needed.
- Dynamic Valuation Model: Automatically updates Net Present Value (NPV) and intrinsic value based on your adjustments.
- Scenario Testing: Develop multiple forecasting scenarios to evaluate various valuation outcomes.
- User-Friendly Design: Intuitive, structured interface suitable for both professionals and newcomers.
How It Works
- Download: Obtain the pre-built Excel file containing WW International, Inc.'s (WW) financial data.
- Customize: Modify projections such as revenue growth, EBITDA %, and WACC to fit your analysis.
- Update Automatically: The intrinsic value and NPV calculations refresh in real-time as you make changes.
- Test Scenarios: Generate various projections and instantly compare the results.
- Make Decisions: Leverage the valuation outcomes to inform your investment decisions.
Why Choose This Calculator for WW International, Inc. (WW)?
- Accurate Data: Utilize real WW financials for dependable valuation outcomes.
- Customizable: Tailor essential parameters such as growth rates, WACC, and tax rates to align with your forecasts.
- Time-Saving: Pre-configured calculations allow you to bypass starting from the beginning.
- Professional-Grade Tool: Crafted for investors, analysts, and consultants focused on WW.
- User-Friendly: Easy-to-navigate design and comprehensive instructions cater to users of all experience levels.
Who Should Use This Product?
- Individual Investors: Gain insights to make informed decisions about investing in WW International, Inc. (WW).
- Financial Analysts: Enhance valuation processes with comprehensive financial models tailored for WW International, Inc. (WW).
- Consultants: Provide clients with accurate and timely valuation analysis for WW International, Inc. (WW).
- Business Owners: Learn how companies like WW International, Inc. (WW) are valued to inform your own business strategies.
- Finance Students: Study valuation methodologies using real-life examples and data from WW International, Inc. (WW).
What the Template Contains
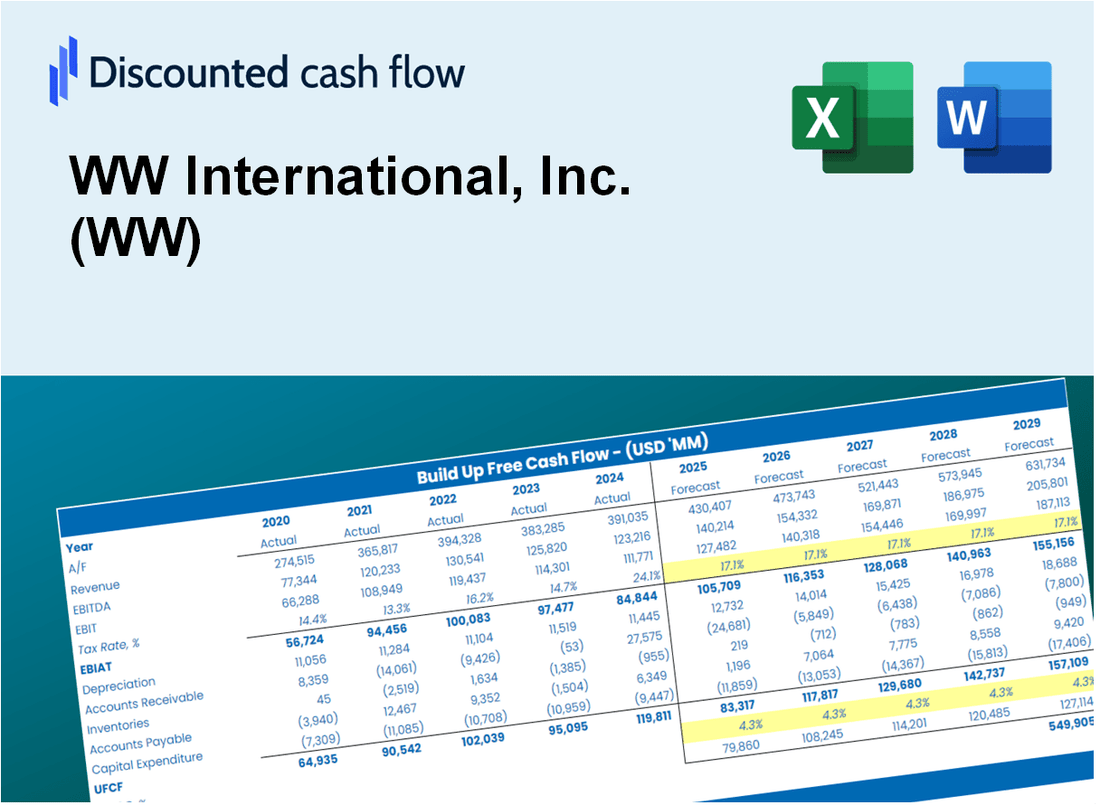
- Operating and Balance Sheet Data: Pre-filled WW International, Inc. (WW) historical data and forecasts, including revenue, EBITDA, EBIT, and capital expenditures.
- WACC Calculation: A dedicated sheet for Weighted Average Cost of Capital (WACC), including parameters like Beta, risk-free rate, and share price.
- DCF Valuation (Unlevered and Levered): Editable Discounted Cash Flow models showing intrinsic value with detailed calculations.
- Financial Statements: Pre-loaded financial statements (annual and quarterly) to support analysis.
- Key Ratios: Includes profitability, leverage, and efficiency ratios for WW International, Inc. (WW).
- Dashboard and Charts: Visual summary of valuation outputs and assumptions to analyze results easily.
Disclaimer
All information, articles, and product details provided on this website are for general informational and educational purposes only. We do not claim any ownership over, nor do we intend to infringe upon, any trademarks, copyrights, logos, brand names, or other intellectual property mentioned or depicted on this site. Such intellectual property remains the property of its respective owners, and any references here are made solely for identification or informational purposes, without implying any affiliation, endorsement, or partnership.
We make no representations or warranties, express or implied, regarding the accuracy, completeness, or suitability of any content or products presented. Nothing on this website should be construed as legal, tax, investment, financial, medical, or other professional advice. In addition, no part of this site—including articles or product references—constitutes a solicitation, recommendation, endorsement, advertisement, or offer to buy or sell any securities, franchises, or other financial instruments, particularly in jurisdictions where such activity would be unlawful.
All content is of a general nature and may not address the specific circumstances of any individual or entity. It is not a substitute for professional advice or services. Any actions you take based on the information provided here are strictly at your own risk. You accept full responsibility for any decisions or outcomes arising from your use of this website and agree to release us from any liability in connection with your use of, or reliance upon, the content or products found herein.