
|
Avaliação do DCF da Y-Mabs Therapeutics, Inc. (YMAB) |
Totalmente Editável: Adapte-Se Às Suas Necessidades No Excel Ou Planilhas
Design Profissional: Modelos Confiáveis E Padrão Da Indústria
Pré-Construídos Para Uso Rápido E Eficiente
Compatível com MAC/PC, totalmente desbloqueado
Não É Necessária Experiência; Fácil De Seguir
Y-mAbs Therapeutics, Inc. (YMAB) Bundle
Simplifique sua análise e melhore a precisão com a nossa calculadora DCF (YMAB)! Equipado com dados reais da Y-Mabs Therapeutics, Inc. e suposições personalizáveis, essa ferramenta o capacita a prever, analisar e valorizar (YMAB) como um investidor experiente.
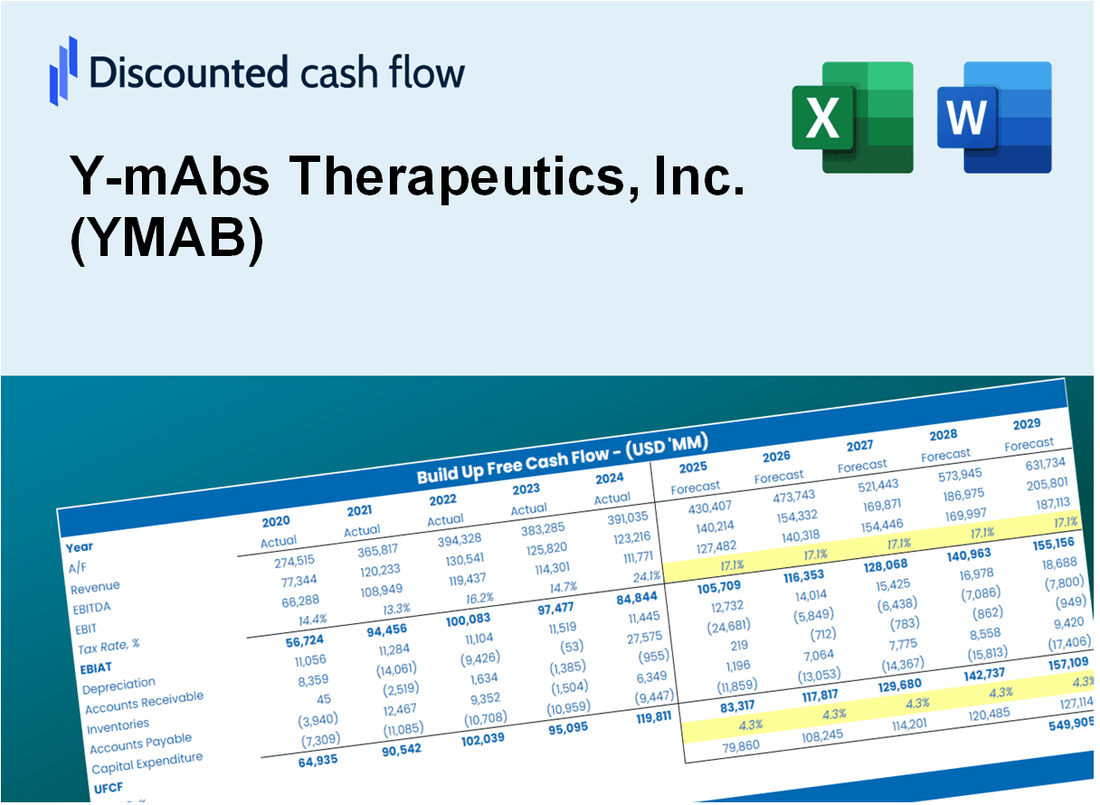
Discounted Cash Flow (DCF) - (USD MM)
| Year | AY1 2020 |
AY2 2021 |
AY3 2022 |
AY4 2023 |
AY5 2024 |
FY1 2025 |
FY2 2026 |
FY3 2027 |
FY4 2028 |
FY5 2029 |
|---|---|---|---|---|---|---|---|---|---|---|
| Revenue | 20.8 | 34.9 | 65.3 | 84.8 | 87.7 | 129.0 | 189.8 | 279.3 | 411.0 | 604.7 |
| Revenue Growth, % | 0 | 68.18 | 87.03 | 29.96 | 3.38 | 47.14 | 47.14 | 47.14 | 47.14 | 47.14 |
| EBITDA | -119.5 | -54.5 | -94.7 | -24.9 | -30.7 | -94.0 | -138.3 | -203.5 | -299.5 | -440.6 |
| EBITDA, % | -576.09 | -156.15 | -145.14 | -29.4 | -34.97 | -72.87 | -72.87 | -72.87 | -72.87 | -72.87 |
| Depreciation | .4 | .8 | .8 | .7 | .5 | 1.8 | 2.6 | 3.9 | 5.7 | 8.4 |
| Depreciation, % | 1.91 | 2.24 | 1.29 | 0.86655 | 0.61014 | 1.38 | 1.38 | 1.38 | 1.38 | 1.38 |
| EBIT | -119.9 | -55.3 | -95.6 | -25.7 | -31.2 | -94.4 | -138.9 | -204.4 | -300.7 | -442.4 |
| EBIT, % | -578 | -158.39 | -146.43 | -30.27 | -35.58 | -73.17 | -73.17 | -73.17 | -73.17 | -73.17 |
| Total Cash | 114.6 | 181.6 | 105.8 | 78.6 | 67.2 | 121.1 | 178.2 | 262.2 | 385.8 | 567.6 |
| Total Cash, percent | .0 | .0 | .0 | .0 | .0 | .0 | .0 | .0 | .0 | .0 |
| Account Receivables | .8 | 7.7 | 12.5 | 22.5 | 19.7 | 24.3 | 35.7 | 52.6 | 77.3 | 113.8 |
| Account Receivables, % | 3.86 | 22.1 | 19.2 | 26.47 | 22.45 | 18.82 | 18.82 | 18.82 | 18.82 | 18.82 |
| Inventories | -.8 | 5.5 | 6.7 | 5.1 | 7.2 | 9.4 | 13.8 | 20.3 | 29.9 | 44.0 |
| Inventories, % | -3.86 | 15.8 | 10.27 | 5.97 | 8.23 | 7.28 | 7.28 | 7.28 | 7.28 | 7.28 |
| Accounts Payable | 9.4 | 13.6 | 14.2 | 6.1 | 6.7 | 31.1 | 45.7 | 67.3 | 99.0 | 145.7 |
| Accounts Payable, % | 45.17 | 38.83 | 21.72 | 7.14 | 7.6 | 24.09 | 24.09 | 24.09 | 24.09 | 24.09 |
| Capital Expenditure | -.2 | -1.0 | .0 | .0 | .0 | -.9 | -1.4 | -2.0 | -3.0 | -4.4 |
| Capital Expenditure, % | -0.84337 | -2.77 | 0 | 0 | 0 | -0.72288 | -0.72288 | -0.72288 | -0.72288 | -0.72288 |
| Tax Rate, % | 0.48974 | 0.48974 | 0.48974 | 0.48974 | 0.48974 | 0.48974 | 0.48974 | 0.48974 | 0.48974 | 0.48974 |
| EBITAT | -119.9 | -55.3 | -95.6 | -26.4 | -31.0 | -94.3 | -138.8 | -204.2 | -300.4 | -442.0 |
| Depreciation | ||||||||||
| Changes in Account Receivables | ||||||||||
| Changes in Inventories | ||||||||||
| Changes in Accounts Payable | ||||||||||
| Capital Expenditure | ||||||||||
| UFCF | -110.3 | -64.5 | -100.1 | -42.0 | -29.3 | -75.8 | -138.7 | -204.1 | -300.3 | -441.9 |
| WACC, % | 6.17 | 6.17 | 6.17 | 6.17 | 6.17 | 6.17 | 6.17 | 6.17 | 6.17 | 6.17 |
| PV UFCF | ||||||||||
| SUM PV UFCF | -929.1 | |||||||||
| Long Term Growth Rate, % | 2.00 | |||||||||
| Free cash flow (T + 1) | -451 | |||||||||
| Terminal Value | -10,817 | |||||||||
| Present Terminal Value | -8,020 | |||||||||
| Enterprise Value | -8,949 | |||||||||
| Net Debt | -66 | |||||||||
| Equity Value | -8,883 | |||||||||
| Diluted Shares Outstanding, MM | 44 | |||||||||
| Equity Value Per Share | -200.38 |
What You Will Get
- Editable Forecast Inputs: Easily modify assumptions (growth %, margins, WACC) to explore various scenarios.
- Real-World Data: Y-mAbs Therapeutics, Inc. (YMAB) financial data pre-filled to kickstart your analysis.
- Automatic DCF Outputs: The template computes Net Present Value (NPV) and intrinsic value automatically for you.
- Customizable and Professional: A refined Excel model that adjusts to your valuation requirements.
- Built for Analysts and Investors: Perfect for evaluating projections, confirming strategies, and enhancing efficiency.
Key Features
- Customizable Research Parameters: Adjust essential inputs such as clinical trial success rates, market penetration, and R&D expenditures.
- Instant Valuation Calculations: Provides real-time assessments of intrinsic value, NPV, and other financial metrics.
- Industry-Leading Precision: Utilizes Y-mAbs Therapeutics' (YMAB) actual financial data for accurate valuation results.
- Effortless Scenario Planning: Easily evaluate various assumptions and analyze different outcomes.
- Efficiency Booster: Streamlines the valuation process, removing the need to develop intricate models from the ground up.
How It Works
- Step 1: Download the prebuilt Excel template featuring Y-mAbs Therapeutics, Inc. (YMAB) data.
- Step 2: Navigate through the pre-filled sheets to grasp the essential metrics.
- Step 3: Modify forecasts and assumptions in the editable yellow cells (WACC, growth, margins).
- Step 4: Instantly observe updated results, including Y-mAbs Therapeutics, Inc. (YMAB)'s intrinsic value.
- Step 5: Make well-informed investment choices or create reports based on the outputs.
Why Choose This Calculator for Y-mAbs Therapeutics, Inc. (YMAB)?
- Designed for Experts: A specialized tool utilized by researchers, investors, and financial analysts.
- Comprehensive Data: Y-mAbs' historical and forecasted financials integrated for precision.
- Flexible Scenario Analysis: Effortlessly model various projections and assumptions.
- Insightful Outputs: Automatically computes intrinsic value, NPV, and essential metrics.
- User-Friendly: Detailed instructions lead you seamlessly through the calculations.
Who Should Use Y-mAbs Therapeutics, Inc. (YMAB)?
- Investors: Gain insights into cutting-edge therapies and make informed investment choices.
- Healthcare Analysts: Streamline your research with comprehensive data on innovative treatments.
- Consultants: Tailor presentations and reports efficiently using our detailed market analysis.
- Biotech Enthusiasts: Expand your knowledge of the biotechnology sector with real-life case studies.
- Educators and Students: Utilize as a resource for practical learning in biotechnology and healthcare finance courses.
What the Template Contains
- Pre-Filled Data: Includes Y-mAbs Therapeutics, Inc.’s (YMAB) historical financials and projections.
- Discounted Cash Flow Model: Editable DCF valuation model with automatic calculations tailored for YMAB.
- Weighted Average Cost of Capital (WACC): A dedicated sheet for calculating WACC based on custom inputs relevant to Y-mAbs.
- Key Financial Ratios: Analyze YMAB’s profitability, efficiency, and leverage metrics.
- Customizable Inputs: Easily modify revenue growth, margins, and tax rates specific to Y-mAbs Therapeutics.
- Clear Dashboard: Charts and tables summarizing key valuation results for Y-mAbs Therapeutics, Inc. (YMAB).
Disclaimer
All information, articles, and product details provided on this website are for general informational and educational purposes only. We do not claim any ownership over, nor do we intend to infringe upon, any trademarks, copyrights, logos, brand names, or other intellectual property mentioned or depicted on this site. Such intellectual property remains the property of its respective owners, and any references here are made solely for identification or informational purposes, without implying any affiliation, endorsement, or partnership.
We make no representations or warranties, express or implied, regarding the accuracy, completeness, or suitability of any content or products presented. Nothing on this website should be construed as legal, tax, investment, financial, medical, or other professional advice. In addition, no part of this site—including articles or product references—constitutes a solicitation, recommendation, endorsement, advertisement, or offer to buy or sell any securities, franchises, or other financial instruments, particularly in jurisdictions where such activity would be unlawful.
All content is of a general nature and may not address the specific circumstances of any individual or entity. It is not a substitute for professional advice or services. Any actions you take based on the information provided here are strictly at your own risk. You accept full responsibility for any decisions or outcomes arising from your use of this website and agree to release us from any liability in connection with your use of, or reliance upon, the content or products found herein.