|
Avanos Medical ، Inc. (AVNS) تقييم DCF |
Fully Editable: Tailor To Your Needs In Excel Or Sheets
Professional Design: Trusted, Industry-Standard Templates
Investor-Approved Valuation Models
MAC/PC Compatible, Fully Unlocked
No Expertise Is Needed; Easy To Follow
Avanos Medical, Inc. (AVNS) Bundle
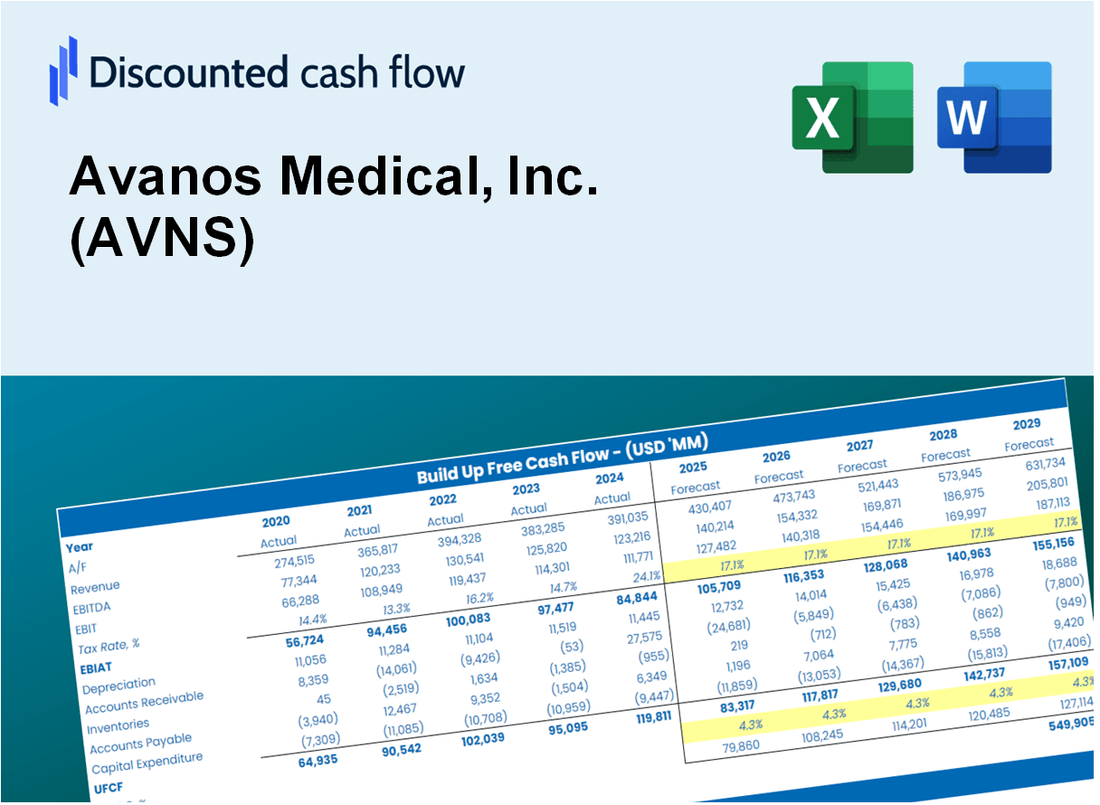
عزز اختياراتك الاستثمارية مع Avanos Medical، Inc. (AVNS) حاسبة DCF! استكشف البيانات المالية الأصلية، وضبط توقعات النمو والنفقات، ولاحظ على الفور آثار هذه التغييرات على القيمة الجوهرية لشركة Avanos Medical، Inc. (AVNS).
What You Will Get
- Editable Excel Template: A fully customizable Excel-based DCF Calculator featuring pre-filled real AVNS financials.
- Real-World Data: Historical data and forward-looking estimates (highlighted in the yellow cells).
- Forecast Flexibility: Adjust forecast assumptions such as revenue growth, EBITDA %, and WACC.
- Automatic Calculations: Instantly observe how your inputs affect Avanos Medical’s valuation.
- Professional Tool: Designed for investors, CFOs, consultants, and financial analysts.
- User-Friendly Design: Organized for clarity and ease of use, complete with step-by-step instructions.
Key Features
- Comprehensive DCF Calculator: Features detailed unlevered and levered DCF valuation models tailored for Avanos Medical, Inc. (AVNS).
- WACC Calculator: Customizable Weighted Average Cost of Capital sheet designed for Avanos Medical, Inc. (AVNS) with pre-set inputs.
- Adjustable Forecast Assumptions: Easily alter growth rates, capital expenditures, and discount rates specific to Avanos Medical, Inc. (AVNS).
- Integrated Financial Ratios: Evaluate profitability, leverage, and efficiency ratios relevant to Avanos Medical, Inc. (AVNS).
- Interactive Dashboard and Charts: Visual representations summarize essential valuation metrics for quick and effective analysis of Avanos Medical, Inc. (AVNS).
How It Works
- Download: Obtain the comprehensive Excel file containing Avanos Medical, Inc.'s (AVNS) financial data.
- Customize: Modify projections, including sales growth, EBITDA %, and WACC.
- Update Automatically: The intrinsic value and NPV calculations refresh in real-time.
- Test Scenarios: Develop various forecasts and instantly analyze the results.
- Make Decisions: Leverage the valuation findings to inform your investment choices.
Why Choose This Calculator for Avanos Medical, Inc. (AVNS)?
- Accurate Data: Up-to-date Avanos Medical financials guarantee trustworthy valuation outcomes.
- Customizable: Modify essential parameters such as growth rates, WACC, and tax rates to align with your forecasts.
- Time-Saving: Integrated calculations streamline your process, removing the need to begin from scratch.
- Professional-Grade Tool: Tailored for investors, analysts, and consultants in the healthcare sector.
- User-Friendly: Simple design and clear, step-by-step guidance make it accessible for all users.
Who Should Use This Product?
- Individual Investors: Make informed decisions about buying or selling Avanos Medical, Inc. (AVNS) stock.
- Financial Analysts: Streamline valuation processes with ready-to-use financial models for Avanos Medical, Inc. (AVNS).
- Consultants: Deliver professional valuation insights on Avanos Medical, Inc. (AVNS) to clients quickly and accurately.
- Business Owners: Understand how medical companies like Avanos Medical, Inc. (AVNS) are valued to guide your own strategy.
- Finance Students: Learn valuation techniques using real-world data and scenarios related to Avanos Medical, Inc. (AVNS).
What the Template Contains
- Historical Data: Includes Avanos Medical, Inc.'s (AVNS) past financials and baseline forecasts.
- DCF and Levered DCF Models: Detailed templates to calculate Avanos Medical, Inc.'s (AVNS) intrinsic value.
- WACC Sheet: Pre-built calculations for Weighted Average Cost of Capital for Avanos Medical, Inc. (AVNS).
- Editable Inputs: Modify key drivers like growth rates, EBITDA %, and CAPEX assumptions specific to Avanos Medical, Inc. (AVNS).
- Quarterly and Annual Statements: A complete breakdown of Avanos Medical, Inc.'s (AVNS) financials.
- Interactive Dashboard: Visualize valuation results and projections for Avanos Medical, Inc. (AVNS) dynamically.
Disclaimer
All information, articles, and product details provided on this website are for general informational and educational purposes only. We do not claim any ownership over, nor do we intend to infringe upon, any trademarks, copyrights, logos, brand names, or other intellectual property mentioned or depicted on this site. Such intellectual property remains the property of its respective owners, and any references here are made solely for identification or informational purposes, without implying any affiliation, endorsement, or partnership.
We make no representations or warranties, express or implied, regarding the accuracy, completeness, or suitability of any content or products presented. Nothing on this website should be construed as legal, tax, investment, financial, medical, or other professional advice. In addition, no part of this site—including articles or product references—constitutes a solicitation, recommendation, endorsement, advertisement, or offer to buy or sell any securities, franchises, or other financial instruments, particularly in jurisdictions where such activity would be unlawful.
All content is of a general nature and may not address the specific circumstances of any individual or entity. It is not a substitute for professional advice or services. Any actions you take based on the information provided here are strictly at your own risk. You accept full responsibility for any decisions or outcomes arising from your use of this website and agree to release us from any liability in connection with your use of, or reliance upon, the content or products found herein.