
|
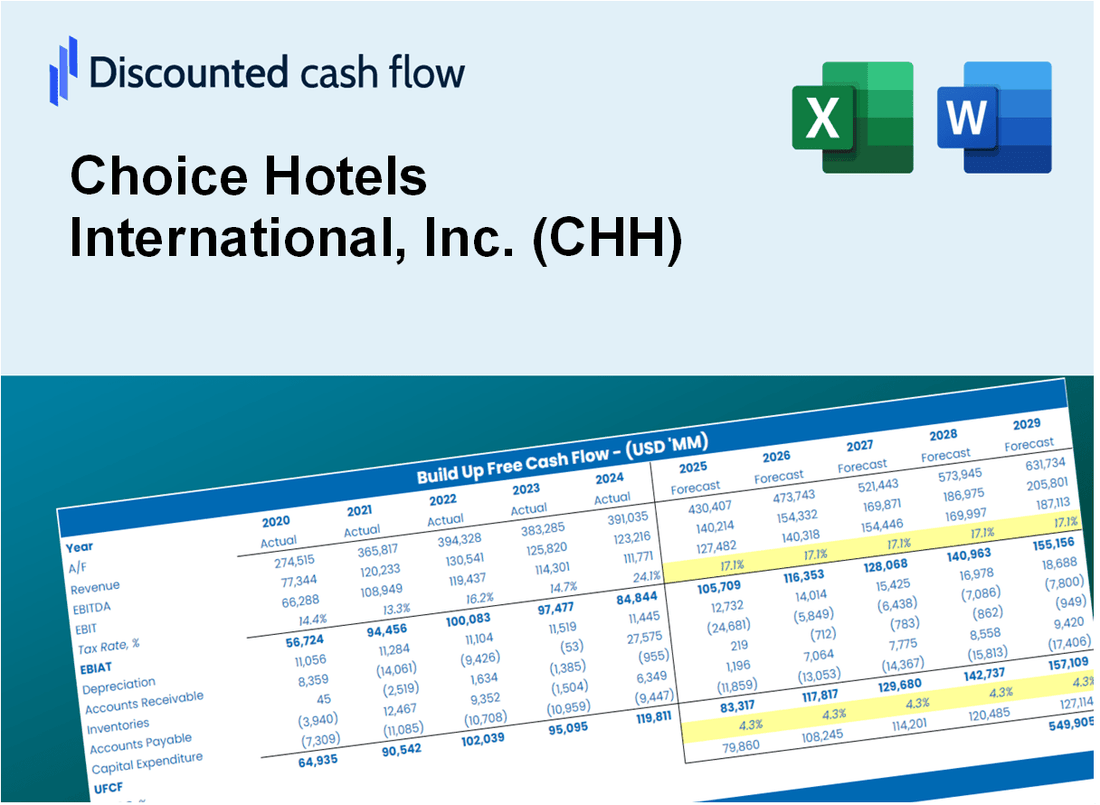
Choice Hotels International ، Inc. (CHH) DCF تقييم |
Fully Editable: Tailor To Your Needs In Excel Or Sheets
Professional Design: Trusted, Industry-Standard Templates
Investor-Approved Valuation Models
MAC/PC Compatible, Fully Unlocked
No Expertise Is Needed; Easy To Follow
Choice Hotels International, Inc. (CHH) Bundle
استكشف النظرة المالية الخاصة بـ Choice Hotels International ، Inc. (CHH) مع حاسبة DCF سهلة الاستخدام! أدخل توقعاتك على النمو وهامش الربح والمصروفات لحساب القيمة الجوهرية المفضلة للاختيار Hotels International ، Inc. (CHH) وإبلاغ قرارات الاستثمار الخاصة بك.
What You Will Get
- Pre-Filled Financial Model: Choice Hotels' actual data enables precise DCF valuation.
- Full Forecast Control: Adjust revenue growth, margins, WACC, and other key drivers.
- Instant Calculations: Automatic updates ensure you see results as you make changes.
- Investor-Ready Template: A refined Excel file designed for professional-grade valuation.
- Customizable and Reusable: Tailored for flexibility, allowing repeated use for detailed forecasts.
Key Features
- Comprehensive Data Access: Choice Hotels' historical financial statements and pre-populated forecasts.
- Customizable Inputs: Modify WACC, tax rates, revenue growth, and EBITDA margins as needed.
- Real-Time Calculations: View the intrinsic value of Choice Hotels recalculated instantly.
- Intuitive Visual Outputs: Dashboard graphs present valuation results and essential metrics clearly.
- Designed for Precision: A reliable tool tailored for analysts, investors, and finance professionals.
How It Works
- Download the Template: Get instant access to the Excel-based CHH DCF Calculator.
- Input Your Assumptions: Adjust yellow-highlighted cells for growth rates, WACC, margins, and more.
- Instant Calculations: The model automatically updates Choice Hotels' intrinsic value.
- Test Scenarios: Simulate different assumptions to evaluate potential valuation changes.
- Analyze and Decide: Use the results to guide your investment or financial analysis.
Why Choose This Calculator for Choice Hotels International, Inc. (CHH)?
- Accurate Data: Real Choice Hotels financials provide dependable valuation outcomes.
- Customizable: Tailor essential parameters like occupancy rates, revenue per available room (RevPAR), and operating expenses to fit your forecasts.
- Time-Saving: Pre-configured calculations save you the hassle of building from the ground up.
- Professional-Grade Tool: Crafted for investors, analysts, and industry consultants.
- User-Friendly: Simple design and clear instructions ensure ease of use for everyone.
Who Should Use This Product?
- Investors: Evaluate Choice Hotels' (CHH) market position before making investment decisions.
- CFOs and Financial Analysts: Enhance valuation methodologies and assess revenue forecasts.
- Hotel Operators: Understand how leading hotel chains like Choice Hotels are appraised.
- Consultants: Create detailed valuation reports for hospitality industry clients.
- Students and Educators: Utilize actual market data to learn and teach valuation strategies.
What the Template Contains
- Historical Data: Includes Choice Hotels’ past financials and baseline forecasts.
- DCF and Levered DCF Models: Detailed templates to calculate Choice Hotels’ intrinsic value.
- WACC Sheet: Pre-built calculations for Weighted Average Cost of Capital.
- Editable Inputs: Modify key drivers like growth rates, EBITDA %, and CAPEX assumptions.
- Quarterly and Annual Statements: A complete breakdown of Choice Hotels’ financials.
- Interactive Dashboard: Visualize valuation results and projections dynamically.
Disclaimer
All information, articles, and product details provided on this website are for general informational and educational purposes only. We do not claim any ownership over, nor do we intend to infringe upon, any trademarks, copyrights, logos, brand names, or other intellectual property mentioned or depicted on this site. Such intellectual property remains the property of its respective owners, and any references here are made solely for identification or informational purposes, without implying any affiliation, endorsement, or partnership.
We make no representations or warranties, express or implied, regarding the accuracy, completeness, or suitability of any content or products presented. Nothing on this website should be construed as legal, tax, investment, financial, medical, or other professional advice. In addition, no part of this site—including articles or product references—constitutes a solicitation, recommendation, endorsement, advertisement, or offer to buy or sell any securities, franchises, or other financial instruments, particularly in jurisdictions where such activity would be unlawful.
All content is of a general nature and may not address the specific circumstances of any individual or entity. It is not a substitute for professional advice or services. Any actions you take based on the information provided here are strictly at your own risk. You accept full responsibility for any decisions or outcomes arising from your use of this website and agree to release us from any liability in connection with your use of, or reliance upon, the content or products found herein.