
|
Sprinklr ، Inc. (CXM) تقييم DCF |
Fully Editable: Tailor To Your Needs In Excel Or Sheets
Professional Design: Trusted, Industry-Standard Templates
Investor-Approved Valuation Models
MAC/PC Compatible, Fully Unlocked
No Expertise Is Needed; Easy To Follow
Sprinklr, Inc. (CXM) Bundle
عزز استراتيجيات الاستثمار الخاصة بك مع حاسبة Sprinklr ، Inc. (CXM) DCF! الغوص في البيانات المالية الأصيلة ، وضبط تنبؤات النمو والنفقات ، ومراقبة على الفور كيف تؤثر هذه التعديلات على القيمة الجوهرية Sprinklr ، Inc. (CXM).
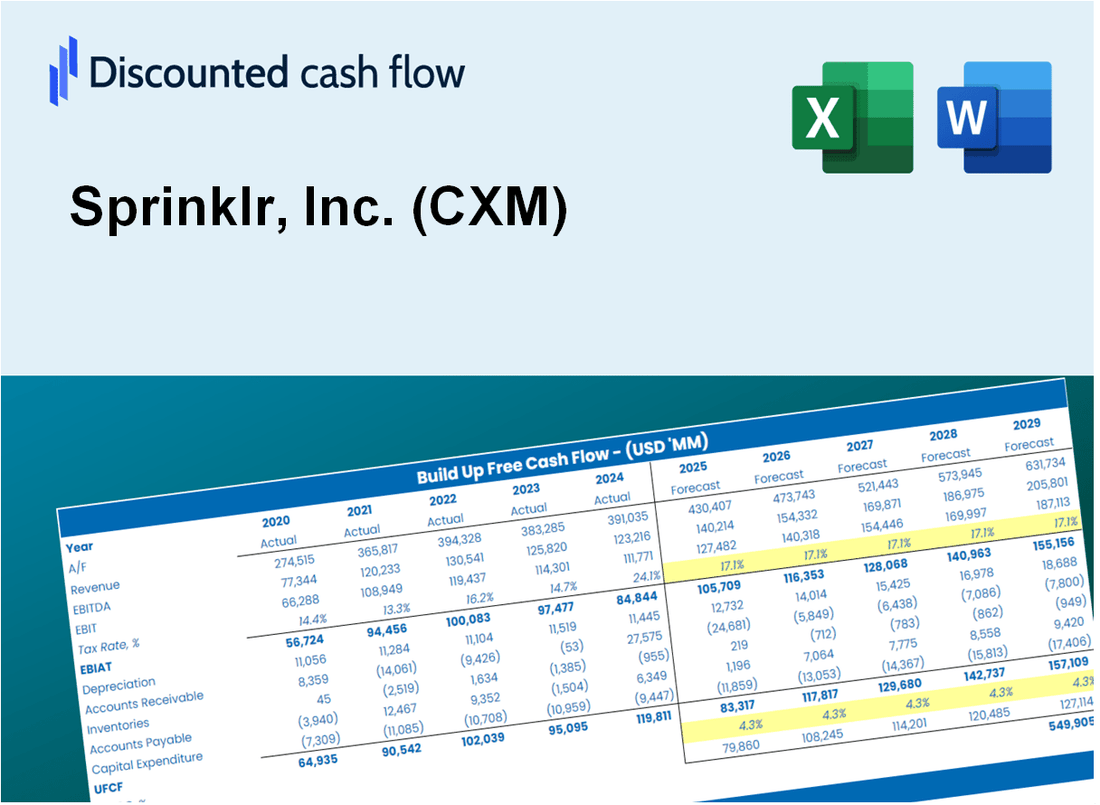
Discounted Cash Flow (DCF) - (USD MM)
| Year | AY1 2021 |
AY2 2022 |
AY3 2023 |
AY4 2024 |
AY5 2025 |
FY1 2026 |
FY2 2027 |
FY3 2028 |
FY4 2029 |
FY5 2030 |
|---|---|---|---|---|---|---|---|---|---|---|
| Revenue | 386.9 | 492.4 | 618.2 | 732.4 | 796.4 | 955.7 | 1,146.9 | 1,376.3 | 1,651.6 | 1,982.0 |
| Revenue Growth, % | 0 | 27.26 | 25.55 | 18.47 | 8.74 | 20 | 20 | 20 | 20 | 20 |
| EBITDA | -19.9 | -79.4 | -39.2 | 49.4 | 42.6 | -29.6 | -35.6 | -42.7 | -51.2 | -61.5 |
| EBITDA, % | -5.14 | -16.13 | -6.34 | 6.75 | 5.36 | -3.1 | -3.1 | -3.1 | -3.1 | -3.1 |
| Depreciation | 5.7 | 8.1 | 18.6 | 15.5 | 18.7 | 20.2 | 24.3 | 29.1 | 34.9 | 41.9 |
| Depreciation, % | 1.47 | 1.64 | 3.02 | 2.11 | 2.35 | 2.12 | 2.12 | 2.12 | 2.12 | 2.12 |
| EBIT | -25.6 | -87.5 | -57.8 | 33.9 | 24.0 | -49.9 | -59.8 | -71.8 | -86.2 | -103.4 |
| EBIT, % | -6.61 | -17.76 | -9.35 | 4.64 | 3.01 | -5.22 | -5.22 | -5.22 | -5.22 | -5.22 |
| Total Cash | 280.7 | 532.4 | 578.6 | 662.6 | 483.5 | 797.7 | 957.2 | 1,148.7 | 1,378.5 | 1,654.3 |
| Total Cash, percent | .0 | .0 | .0 | .0 | .0 | .0 | .0 | .0 | .0 | .0 |
| Account Receivables | 117.1 | 166.8 | 212.2 | 275.6 | 293.3 | 330.5 | 396.7 | 476.0 | 571.2 | 685.5 |
| Account Receivables, % | 30.26 | 33.88 | 34.32 | 37.63 | 36.83 | 34.59 | 34.59 | 34.59 | 34.59 | 34.59 |
| Inventories | 62.2 | .0 | .0 | .0 | .0 | 30.7 | 36.8 | 44.2 | 53.1 | 63.7 |
| Inventories, % | 16.06 | 0 | 0 | 0 | 0 | 3.21 | 3.21 | 3.21 | 3.21 | 3.21 |
| Accounts Payable | 17.0 | 15.8 | 30.1 | 34.7 | 27.4 | 39.4 | 47.3 | 56.8 | 68.2 | 81.8 |
| Accounts Payable, % | 4.38 | 3.21 | 4.87 | 4.74 | 3.43 | 4.13 | 4.13 | 4.13 | 4.13 | 4.13 |
| Capital Expenditure | -6.5 | -12.4 | -16.4 | -20.3 | -5.8 | -19.8 | -23.8 | -28.5 | -34.2 | -41.1 |
| Capital Expenditure, % | -1.68 | -2.52 | -2.66 | -2.78 | -0.72853 | -2.07 | -2.07 | -2.07 | -2.07 | -2.07 |
| Tax Rate, % | -151.82 | -151.82 | -151.82 | -151.82 | -151.82 | -151.82 | -151.82 | -151.82 | -151.82 | -151.82 |
| EBITAT | -28.2 | -93.3 | -67.9 | 28.8 | 60.4 | -48.4 | -58.0 | -69.6 | -83.6 | -100.3 |
| Depreciation | ||||||||||
| Changes in Account Receivables | ||||||||||
| Changes in Inventories | ||||||||||
| Changes in Accounts Payable | ||||||||||
| Capital Expenditure | ||||||||||
| UFCF | -191.3 | -86.3 | -96.7 | -34.9 | 48.2 | -103.8 | -121.9 | -146.3 | -175.5 | -210.7 |
| WACC, % | 7.32 | 7.32 | 7.32 | 7.31 | 7.32 | 7.32 | 7.32 | 7.32 | 7.32 | 7.32 |
| PV UFCF | ||||||||||
| SUM PV UFCF | -601.1 | |||||||||
| Long Term Growth Rate, % | 2.00 | |||||||||
| Free cash flow (T + 1) | -215 | |||||||||
| Terminal Value | -4,037 | |||||||||
| Present Terminal Value | -2,836 | |||||||||
| Enterprise Value | -3,437 | |||||||||
| Net Debt | -97 | |||||||||
| Equity Value | -3,340 | |||||||||
| Diluted Shares Outstanding, MM | 275 | |||||||||
| Equity Value Per Share | -12.16 |
What You Will Get
- Real Sprinklr Data: Preloaded financials – from revenue to EBIT – based on actual and projected figures for Sprinklr, Inc. (CXM).
- Full Customization: Adjust all critical parameters (yellow cells) such as WACC, growth %, and tax rates to fit your analysis.
- Instant Valuation Updates: Automatic recalculations to assess the impact of changes on Sprinklr’s fair value.
- Versatile Excel Template: Designed for quick edits, scenario testing, and comprehensive projections tailored to Sprinklr, Inc. (CXM).
- Time-Saving and Accurate: Avoid building models from scratch while ensuring precision and flexibility in your financial assessments.
Key Features
- Comprehensive Data: Sprinklr’s historical performance metrics and pre-populated projections.
- Customizable Parameters: Adjust inputs for customer acquisition costs, retention rates, and revenue forecasts.
- Real-Time Analysis: Monitor Sprinklr’s intrinsic value updates instantly.
- Intuitive Visualizations: Interactive dashboards present valuation insights and essential statistics.
- Designed for Precision: A robust tool tailored for analysts, investors, and finance professionals.
How It Works
- Step 1: Download the prebuilt Excel template featuring Sprinklr’s data included.
- Step 2: Navigate through the pre-filled sheets to grasp the essential metrics.
- Step 3: Adjust forecasts and assumptions in the editable yellow cells (WACC, growth, margins).
- Step 4: Instantly see recalculated results, including Sprinklr’s intrinsic value.
- Step 5: Make well-informed investment decisions or create reports using the generated outputs.
Why Choose the Sprinklr Calculator?
- All-in-One Solution: Combines DCF, WACC, and financial ratio analyses tailored for Sprinklr, Inc. (CXM).
- Flexible Inputs: Modify the highlighted cells to explore different financial scenarios.
- In-Depth Analysis: Automatically determines Sprinklr’s intrinsic value and Net Present Value.
- Data-Rich Environment: Historical and projected data provide reliable benchmarks.
- Expert-Level Tools: Perfect for financial analysts, investors, and business consultants focused on Sprinklr, Inc. (CXM).
Who Should Use This Product?
- Investors: Evaluate Sprinklr’s valuation before making investment decisions.
- CFOs and Financial Analysts: Optimize valuation methodologies and assess financial forecasts.
- Startup Founders: Understand how leading companies like Sprinklr are valued in the market.
- Consultants: Provide detailed valuation analysis and reports for clients.
- Students and Educators: Utilize real-world data from Sprinklr to learn and teach valuation strategies.
What the Template Contains
- Operating and Balance Sheet Data: Pre-filled Sprinklr historical data and forecasts, including revenue, EBITDA, EBIT, and capital expenditures.
- WACC Calculation: A dedicated sheet for Weighted Average Cost of Capital (WACC), featuring parameters such as Beta, risk-free rate, and share price.
- DCF Valuation (Unlevered and Levered): Editable Discounted Cash Flow models that display intrinsic value with comprehensive calculations.
- Financial Statements: Pre-loaded financial statements (annual and quarterly) to facilitate thorough analysis.
- Key Ratios: Includes profitability, leverage, and efficiency ratios for Sprinklr, Inc. (CXM).
- Dashboard and Charts: Visual summary of valuation outputs and assumptions to simplify the analysis of results.
Disclaimer
All information, articles, and product details provided on this website are for general informational and educational purposes only. We do not claim any ownership over, nor do we intend to infringe upon, any trademarks, copyrights, logos, brand names, or other intellectual property mentioned or depicted on this site. Such intellectual property remains the property of its respective owners, and any references here are made solely for identification or informational purposes, without implying any affiliation, endorsement, or partnership.
We make no representations or warranties, express or implied, regarding the accuracy, completeness, or suitability of any content or products presented. Nothing on this website should be construed as legal, tax, investment, financial, medical, or other professional advice. In addition, no part of this site—including articles or product references—constitutes a solicitation, recommendation, endorsement, advertisement, or offer to buy or sell any securities, franchises, or other financial instruments, particularly in jurisdictions where such activity would be unlawful.
All content is of a general nature and may not address the specific circumstances of any individual or entity. It is not a substitute for professional advice or services. Any actions you take based on the information provided here are strictly at your own risk. You accept full responsibility for any decisions or outcomes arising from your use of this website and agree to release us from any liability in connection with your use of, or reliance upon, the content or products found herein.