
|
Dillard's ، Inc. (DDS) تقييم DCF |
Fully Editable: Tailor To Your Needs In Excel Or Sheets
Professional Design: Trusted, Industry-Standard Templates
Investor-Approved Valuation Models
MAC/PC Compatible, Fully Unlocked
No Expertise Is Needed; Easy To Follow
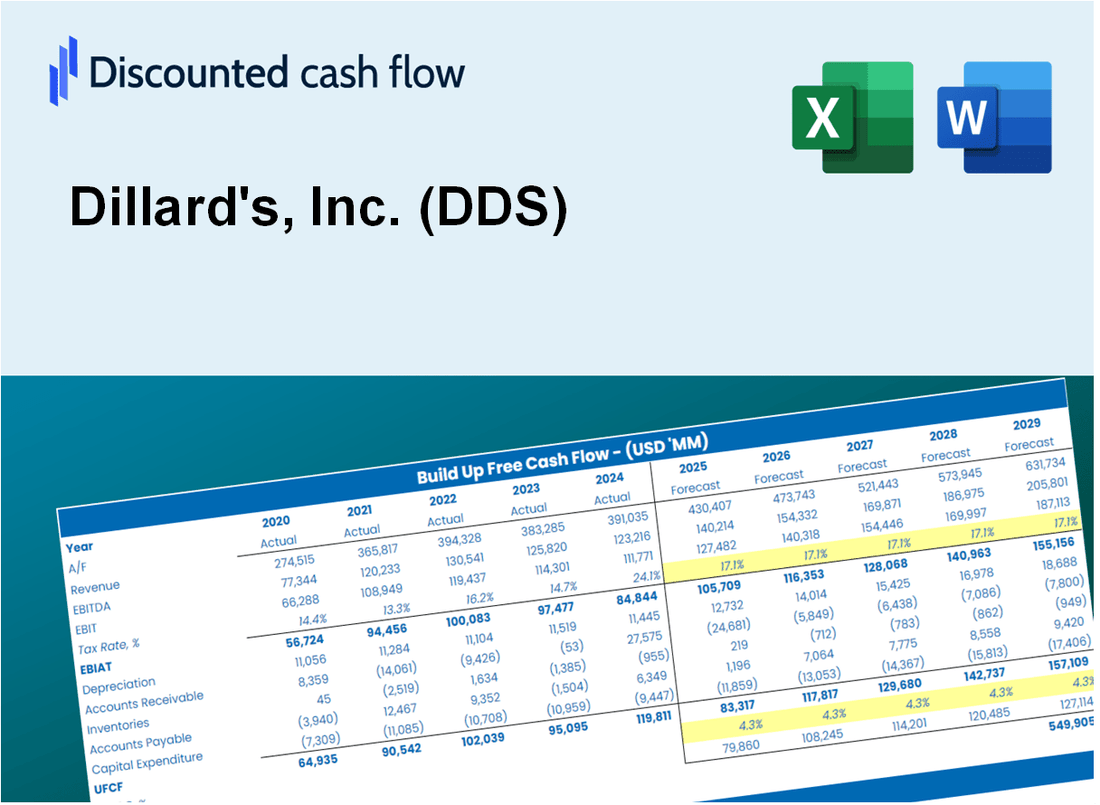
Dillard's, Inc. (DDS) Bundle
Simplify Dillard's ، Inc. (DDS) تقييم مع حاسبة DCF القابلة للتخصيص! يضم REAL Dillard's ، Inc. (DDS) والمدخلات المتوقعة القابلة للتعديل ، يمكنك اختبار السيناريوهات وكشف القيمة العادلة Dillard's ، Inc. (DDS) في دقائق.
What You Will Receive
- Pre-Filled Financial Model: Dillard's, Inc.'s (DDS) actual data provides an accurate DCF valuation.
- Comprehensive Forecast Control: Modify revenue growth, profit margins, WACC, and other critical factors.
- Real-Time Calculations: Automatic updates ensure immediate visibility of results as adjustments are made.
- Investor-Ready Template: A polished Excel file crafted for high-quality valuation presentations.
- Customizable and Reusable: Designed for versatility, enabling repeated application for in-depth forecasts.
Key Features
- Comprehensive DCF Calculator: Offers detailed unlevered and levered DCF valuation frameworks tailored for Dillard's, Inc. (DDS).
- WACC Calculator: Features a pre-configured Weighted Average Cost of Capital sheet with adjustable parameters.
- Customizable Forecast Assumptions: Easily adjust growth rates, capital expenditures, and discount rates to fit Dillard's financial outlook.
- Integrated Financial Ratios: Evaluate profitability, leverage, and efficiency ratios specifically for Dillard's, Inc. (DDS).
- Interactive Dashboard and Charts: Visual representations provide a clear summary of essential valuation metrics for straightforward analysis.
How It Works
- Download the Template: Gain immediate access to the Excel-based DDS DCF Calculator.
- Input Your Assumptions: Modify the yellow-highlighted cells for growth rates, WACC, margins, and additional inputs.
- Instant Calculations: The model automatically refreshes Dillard's intrinsic value.
- Test Scenarios: Experiment with various assumptions to assess potential valuation shifts.
- Analyze and Decide: Leverage the results to inform your investment or financial strategy.
Why Choose This Calculator?
- User-Friendly Interface: Tailored for both novices and seasoned professionals.
- Customizable Inputs: Adjust parameters to suit your specific analysis needs.
- Real-Time Valuation: Watch Dillard's, Inc. (DDS) valuation update instantly as you change inputs.
- Preloaded Data: Comes equipped with Dillard's, Inc. (DDS) actual financial information for immediate assessments.
- Relied Upon by Experts: Favored by investors and analysts for making educated choices.
Who Should Use This Product?
- Investors: Evaluate Dillard's, Inc. (DDS) performance before making investment decisions.
- CFOs and Financial Analysts: Optimize valuation methodologies and assess financial forecasts.
- Startup Founders: Understand the valuation strategies of established retailers like Dillard's, Inc. (DDS).
- Consultants: Provide clients with comprehensive valuation analyses for retail businesses.
- Students and Educators: Utilize current data to learn and teach valuation practices in retail markets.
What the Template Contains
- Comprehensive DCF Model: Editable template with detailed valuation calculations tailored for Dillard's, Inc. (DDS).
- Real-World Data: Dillard's historical and projected financials preloaded for thorough analysis.
- Customizable Parameters: Adjust WACC, growth rates, and tax assumptions to explore various scenarios.
- Financial Statements: Complete annual and quarterly breakdowns for in-depth insights into Dillard's performance.
- Key Ratios: Built-in analysis for profitability, efficiency, and leverage specific to Dillard's, Inc. (DDS).
- Dashboard with Visual Outputs: Charts and tables for clear, actionable results regarding Dillard's financial health.
Disclaimer
All information, articles, and product details provided on this website are for general informational and educational purposes only. We do not claim any ownership over, nor do we intend to infringe upon, any trademarks, copyrights, logos, brand names, or other intellectual property mentioned or depicted on this site. Such intellectual property remains the property of its respective owners, and any references here are made solely for identification or informational purposes, without implying any affiliation, endorsement, or partnership.
We make no representations or warranties, express or implied, regarding the accuracy, completeness, or suitability of any content or products presented. Nothing on this website should be construed as legal, tax, investment, financial, medical, or other professional advice. In addition, no part of this site—including articles or product references—constitutes a solicitation, recommendation, endorsement, advertisement, or offer to buy or sell any securities, franchises, or other financial instruments, particularly in jurisdictions where such activity would be unlawful.
All content is of a general nature and may not address the specific circumstances of any individual or entity. It is not a substitute for professional advice or services. Any actions you take based on the information provided here are strictly at your own risk. You accept full responsibility for any decisions or outcomes arising from your use of this website and agree to release us from any liability in connection with your use of, or reliance upon, the content or products found herein.