
|
Canada Goose Holdings Inc. (GOOS) DCF تقييم |
Fully Editable: Tailor To Your Needs In Excel Or Sheets
Professional Design: Trusted, Industry-Standard Templates
Investor-Approved Valuation Models
MAC/PC Compatible, Fully Unlocked
No Expertise Is Needed; Easy To Follow
Canada Goose Holdings Inc. (GOOS) Bundle
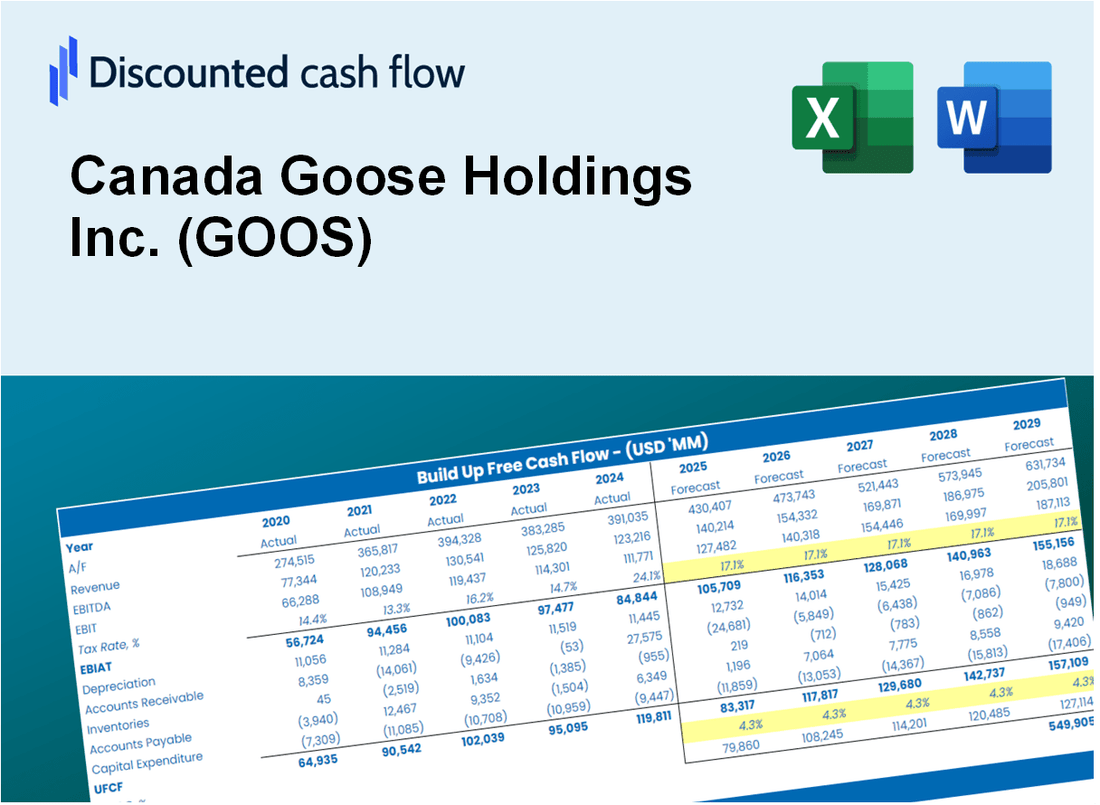
تمكنك حاسبة DCF Canada التي تم تصميمها من أجل الدقة ، وتمكنك من تقييم تقييم كندا أوزة باستخدام البيانات المالية الحقيقية ، مع توفير المرونة لتعديل جميع المعلمات الرئيسية لتحسين التوقعات.
What You Will Get
- Real GOOS Financials: Access to historical and projected data for precise valuation.
- Customizable Inputs: Adjust WACC, tax rates, revenue growth, and capital expenditures as needed.
- Dynamic Calculations: Intrinsic value and NPV are automatically computed.
- Scenario Analysis: Evaluate various scenarios to assess Canada Goose's future outlook.
- User-Friendly Design: Designed for professionals while remaining approachable for newcomers.
Key Features
- Authentic Canada Goose Financials: Gain access to precise pre-loaded historical data and forward-looking projections.
- Adjustable Forecast Parameters: Modify yellow-highlighted cells such as WACC, growth rates, and profit margins.
- Real-Time Calculations: Automatic updates for DCF, Net Present Value (NPV), and cash flow assessments.
- Interactive Dashboard: User-friendly charts and summaries to visualize your valuation outcomes.
- Designed for All Users: An intuitive layout tailored for investors, CFOs, and consultants alike.
How It Works
- Download: Get the pre-built Excel file featuring Canada Goose Holdings Inc.'s (GOOS) financial data.
- Customize: Modify projections, including sales growth, EBITDA margin, and discount rate.
- Update Automatically: The intrinsic value and NPV calculations refresh in real-time.
- Test Scenarios: Generate various forecasts and instantly compare results.
- Make Decisions: Leverage the valuation insights to inform your investment approach.
Why Choose This Calculator for Canada Goose Holdings Inc. (GOOS)?
- Accurate Data: Utilize real Canada Goose financials for dependable valuation outcomes.
- Customizable: Modify essential parameters such as growth rates, WACC, and tax rates to align with your forecasts.
- Time-Saving: Pre-built calculations streamline your process, avoiding the need to start from the ground up.
- Professional-Grade Tool: Tailored for investors, analysts, and consultants in the industry.
- User-Friendly: Easy-to-navigate interface and clear, step-by-step instructions cater to users of all experience levels.
Who Should Use This Product?
- Individual Investors: Make informed decisions about buying or selling Canada Goose Holdings Inc. (GOOS) stock.
- Financial Analysts: Streamline valuation processes with ready-to-use financial models specific to Canada Goose.
- Consultants: Deliver professional valuation insights on Canada Goose to clients quickly and accurately.
- Business Owners: Understand how premium brands like Canada Goose are valued to guide your own business strategy.
- Finance Students: Learn valuation techniques using real-world data and scenarios related to Canada Goose Holdings Inc. (GOOS).
What the Template Contains
- Operating and Balance Sheet Data: Pre-filled Canada Goose Holdings Inc. (GOOS) historical data and forecasts, including revenue, EBITDA, EBIT, and capital expenditures.
- WACC Calculation: A dedicated sheet for Weighted Average Cost of Capital (WACC), featuring parameters like Beta, risk-free rate, and share price.
- DCF Valuation (Unlevered and Levered): Editable Discounted Cash Flow models displaying intrinsic value with comprehensive calculations.
- Financial Statements: Pre-loaded financial statements (annual and quarterly) to aid in analysis.
- Key Ratios: Includes profitability, leverage, and efficiency ratios for Canada Goose Holdings Inc. (GOOS).
- Dashboard and Charts: Visual summary of valuation outputs and assumptions for straightforward analysis of results.
Disclaimer
All information, articles, and product details provided on this website are for general informational and educational purposes only. We do not claim any ownership over, nor do we intend to infringe upon, any trademarks, copyrights, logos, brand names, or other intellectual property mentioned or depicted on this site. Such intellectual property remains the property of its respective owners, and any references here are made solely for identification or informational purposes, without implying any affiliation, endorsement, or partnership.
We make no representations or warranties, express or implied, regarding the accuracy, completeness, or suitability of any content or products presented. Nothing on this website should be construed as legal, tax, investment, financial, medical, or other professional advice. In addition, no part of this site—including articles or product references—constitutes a solicitation, recommendation, endorsement, advertisement, or offer to buy or sell any securities, franchises, or other financial instruments, particularly in jurisdictions where such activity would be unlawful.
All content is of a general nature and may not address the specific circumstances of any individual or entity. It is not a substitute for professional advice or services. Any actions you take based on the information provided here are strictly at your own risk. You accept full responsibility for any decisions or outcomes arising from your use of this website and agree to release us from any liability in connection with your use of, or reliance upon, the content or products found herein.