|
شركة Harmony Gold Mining Company Limited (HMY) DCF تقييم |
Fully Editable: Tailor To Your Needs In Excel Or Sheets
Professional Design: Trusted, Industry-Standard Templates
Investor-Approved Valuation Models
MAC/PC Compatible, Fully Unlocked
No Expertise Is Needed; Easy To Follow
Harmony Gold Mining Company Limited (HMY) Bundle
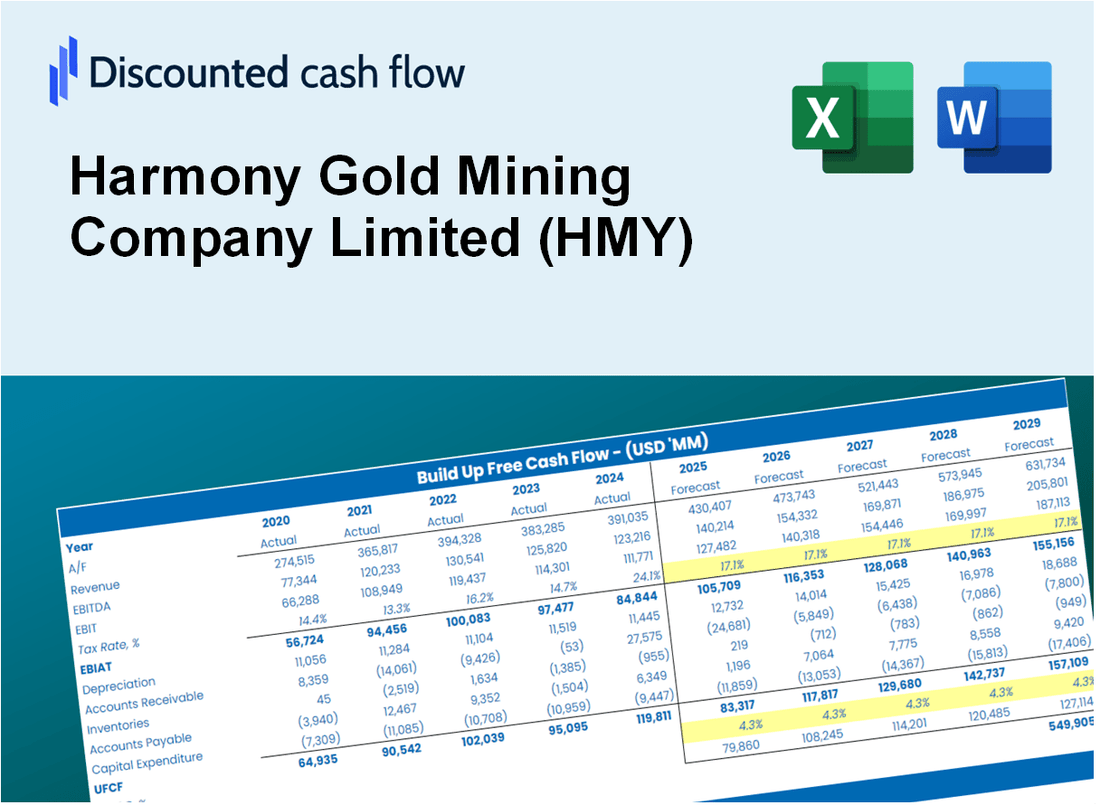
عزز استراتيجيات الاستثمار الخاصة بك مع حاسبة Harmony Gold Mining Company Limited (HMY) DCF! الاستفادة من البيانات المالية الحقيقية ، وضبط توقعات النمو والنفقات ، ولاحظ كيف تؤثر هذه التعديلات على القيمة الجوهرية لشركة Harmony Gold Mining Company Limited (HMY) في الوقت الفعلي.
What You Will Receive
- Pre-Filled Financial Model: Harmony Gold's actual data enables accurate DCF valuation.
- Full Forecast Control: Modify production levels, cost structures, discount rates, and other essential factors.
- Instant Calculations: Real-time updates provide immediate feedback as you adjust inputs.
- Investor-Ready Template: A polished Excel file crafted for high-quality valuation presentations.
- Customizable and Reusable: Designed for adaptability, allowing for repeated use in comprehensive forecasts.
Key Features
- Comprehensive Data: Harmony Gold's historical financial reports and pre-filled projections.
- Customizable Parameters: Modify WACC, tax rates, production growth, and EBITDA margins.
- Real-Time Insights: View Harmony Gold's intrinsic value update instantly.
- Visual Representation: Dashboard graphs illustrate valuation outcomes and essential metrics.
- Designed for Precision: A professional-grade tool for analysts, investors, and finance professionals.
How It Works
- Step 1: Download the Excel file for Harmony Gold Mining Company Limited (HMY).
- Step 2: Review the pre-filled financial data and forecasts for Harmony Gold.
- Step 3: Adjust key inputs such as gold production, operating costs, and tax rates (highlighted cells).
- Step 4: Observe the DCF model update in real-time as you modify your assumptions.
- Step 5: Evaluate the outputs and leverage the results for your investment strategies.
Why Choose This Calculator?
- User-Friendly Interface: Perfect for both novices and seasoned professionals.
- Customizable Inputs: Easily adjust parameters to suit your specific analysis.
- Real-Time Feedback: Monitor immediate changes to Harmony Gold Mining’s valuation as you tweak inputs.
- Preloaded Data: Comes with Harmony Gold's actual financial figures for swift evaluations.
- Preferred by Experts: Utilized by investors and analysts for making well-informed choices.
Who Should Use This Product?
- Investors: Assess Harmony Gold Mining Company's (HMY) market value before making investment decisions.
- CFOs and Financial Analysts: Optimize valuation processes and evaluate future projections for mining operations.
- Mining Executives: Understand how major mining companies like Harmony Gold are valued in the industry.
- Consultants: Provide comprehensive valuation reports tailored for clients in the mining sector.
- Students and Educators: Utilize industry-specific data to teach and practice valuation methodologies.
What the Template Contains
- Preloaded HMY Data: Historical and projected financial data, including revenue, EBIT, and capital expenditures.
- DCF and WACC Models: Professional-grade sheets for calculating intrinsic value and Weighted Average Cost of Capital.
- Editable Inputs: Yellow-highlighted cells for adjusting revenue growth, tax rates, and discount rates.
- Financial Statements: Comprehensive annual and quarterly financials for deeper analysis.
- Key Ratios: Profitability, leverage, and efficiency ratios to evaluate performance.
- Dashboard and Charts: Visual summaries of valuation outcomes and assumptions.
Disclaimer
All information, articles, and product details provided on this website are for general informational and educational purposes only. We do not claim any ownership over, nor do we intend to infringe upon, any trademarks, copyrights, logos, brand names, or other intellectual property mentioned or depicted on this site. Such intellectual property remains the property of its respective owners, and any references here are made solely for identification or informational purposes, without implying any affiliation, endorsement, or partnership.
We make no representations or warranties, express or implied, regarding the accuracy, completeness, or suitability of any content or products presented. Nothing on this website should be construed as legal, tax, investment, financial, medical, or other professional advice. In addition, no part of this site—including articles or product references—constitutes a solicitation, recommendation, endorsement, advertisement, or offer to buy or sell any securities, franchises, or other financial instruments, particularly in jurisdictions where such activity would be unlawful.
All content is of a general nature and may not address the specific circumstances of any individual or entity. It is not a substitute for professional advice or services. Any actions you take based on the information provided here are strictly at your own risk. You accept full responsibility for any decisions or outcomes arising from your use of this website and agree to release us from any liability in connection with your use of, or reliance upon, the content or products found herein.