
|
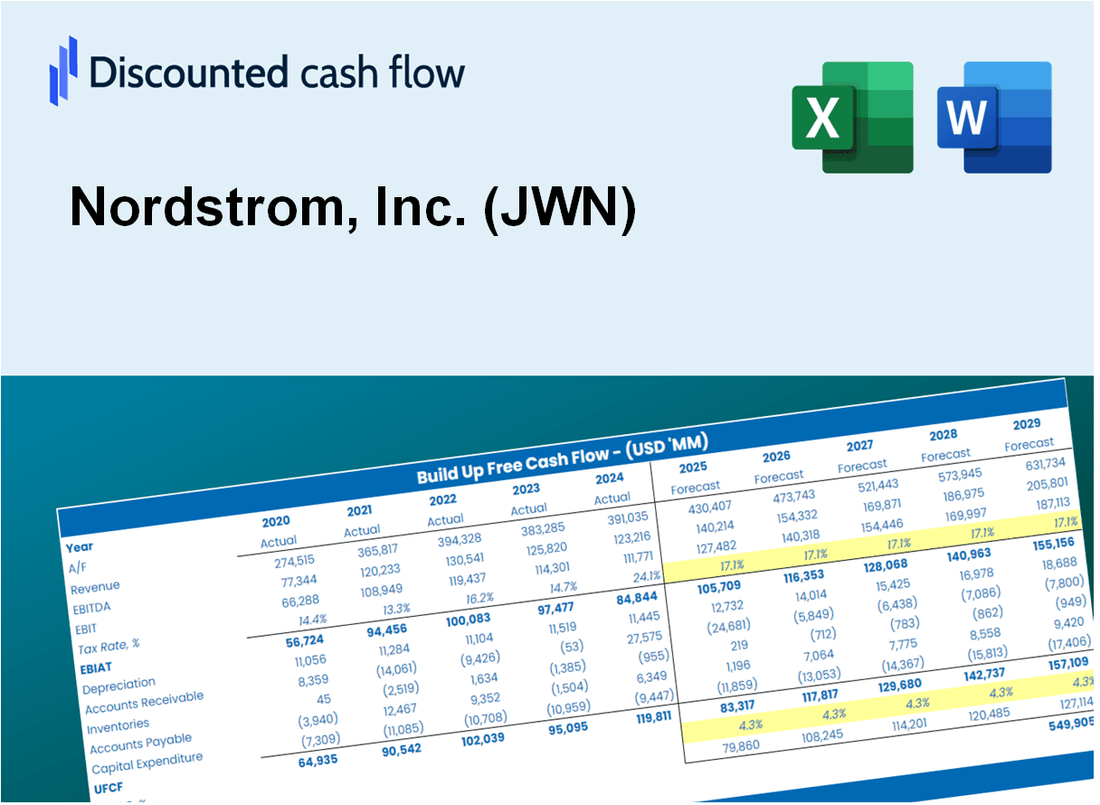
Nordstrom ، Inc. (JWN) تقييم DCF |
Fully Editable: Tailor To Your Needs In Excel Or Sheets
Professional Design: Trusted, Industry-Standard Templates
Investor-Approved Valuation Models
MAC/PC Compatible, Fully Unlocked
No Expertise Is Needed; Easy To Follow
Nordstrom, Inc. (JWN) Bundle
سواء كنت مستثمرًا أو محللًا ، فإن حاسبة DCF (JWN) هذه هي موردك للتقييم الدقيق. يضم بيانات حقيقية من Nordstrom ، Inc. ، يمكنك بسهولة ضبط التنبؤات ومراقبة التأثيرات في الوقت الفعلي.
Discounted Cash Flow (DCF) - (USD MM)
| Year | AY1 2020 |
AY2 2021 |
AY3 2022 |
AY4 2023 |
AY5 2024 |
FY1 2025 |
FY2 2026 |
FY3 2027 |
FY4 2028 |
FY5 2029 |
|---|---|---|---|---|---|---|---|---|---|---|
| Revenue | 10,715.0 | 14,789.0 | 15,530.0 | 14,693.0 | 15,016.0 | 16,511.6 | 18,156.2 | 19,964.6 | 21,953.1 | 24,139.7 |
| Revenue Growth, % | 0 | 38.02 | 5.01 | -5.39 | 2.2 | 9.96 | 9.96 | 9.96 | 9.96 | 9.96 |
| EBITDA | -205.0 | 1,283.0 | 1,264.0 | 1,054.0 | 1,318.0 | 1,018.8 | 1,120.3 | 1,231.9 | 1,354.6 | 1,489.5 |
| EBITDA, % | -1.91 | 8.68 | 8.14 | 7.17 | 8.78 | 6.17 | 6.17 | 6.17 | 6.17 | 6.17 |
| Depreciation | 839.0 | 790.0 | 789.0 | 770.0 | 790.0 | 949.6 | 1,044.1 | 1,148.1 | 1,262.5 | 1,388.2 |
| Depreciation, % | 7.83 | 5.34 | 5.08 | 5.24 | 5.26 | 5.75 | 5.75 | 5.75 | 5.75 | 5.75 |
| EBIT | -1,044.0 | 493.0 | 475.0 | 284.0 | 528.0 | 69.3 | 76.2 | 83.8 | 92.1 | 101.3 |
| EBIT, % | -9.74 | 3.33 | 3.06 | 1.93 | 3.52 | 0.41959 | 0.41959 | 0.41959 | 0.41959 | 0.41959 |
| Total Cash | 681.0 | 322.0 | 687.0 | 628.0 | 1,035.0 | 796.6 | 876.0 | 963.2 | 1,059.2 | 1,164.7 |
| Total Cash, percent | .0 | .0 | .0 | .0 | .0 | .0 | .0 | .0 | .0 | .0 |
| Account Receivables | 245.0 | 255.0 | 265.0 | 334.0 | 245.0 | 317.7 | 349.4 | 384.2 | 422.5 | 464.5 |
| Account Receivables, % | 2.29 | 1.72 | 1.71 | 2.27 | 1.63 | 1.92 | 1.92 | 1.92 | 1.92 | 1.92 |
| Inventories | 1,863.0 | 2,289.0 | 1,941.0 | 1,888.0 | 2,104.0 | 2,385.1 | 2,622.6 | 2,883.9 | 3,171.1 | 3,486.9 |
| Inventories, % | 17.39 | 15.48 | 12.5 | 12.85 | 14.01 | 14.44 | 14.44 | 14.44 | 14.44 | 14.44 |
| Accounts Payable | 1,960.0 | 1,529.0 | 1,238.0 | 1,236.0 | 1,288.0 | 1,769.8 | 1,946.1 | 2,139.9 | 2,353.0 | 2,587.4 |
| Accounts Payable, % | 18.29 | 10.34 | 7.97 | 8.41 | 8.58 | 10.72 | 10.72 | 10.72 | 10.72 | 10.72 |
| Capital Expenditure | -385.0 | -506.0 | -473.0 | -569.0 | -516.0 | -573.6 | -630.7 | -693.5 | -762.6 | -838.6 |
| Capital Expenditure, % | -3.59 | -3.42 | -3.05 | -3.87 | -3.44 | -3.47 | -3.47 | -3.47 | -3.47 | -3.47 |
| Tax Rate, % | 25.19 | 25.19 | 25.19 | 25.19 | 25.19 | 25.19 | 25.19 | 25.19 | 25.19 | 25.19 |
| EBITAT | -586.6 | 356.7 | 345.3 | 258.9 | 395.0 | 50.9 | 55.9 | 61.5 | 67.7 | 74.4 |
| Depreciation | ||||||||||
| Changes in Account Receivables | ||||||||||
| Changes in Inventories | ||||||||||
| Changes in Accounts Payable | ||||||||||
| Capital Expenditure | ||||||||||
| UFCF | -280.6 | -226.3 | 708.3 | 441.9 | 594.0 | 554.8 | 376.4 | 413.9 | 455.2 | 500.5 |
| WACC, % | 8.63 | 8.96 | 8.97 | 9.34 | 9.01 | 8.98 | 8.98 | 8.98 | 8.98 | 8.98 |
| PV UFCF | ||||||||||
| SUM PV UFCF | 1,794.0 | |||||||||
| Long Term Growth Rate, % | 2.00 | |||||||||
| Free cash flow (T + 1) | 510 | |||||||||
| Terminal Value | 7,311 | |||||||||
| Present Terminal Value | 4,756 | |||||||||
| Enterprise Value | 6,550 | |||||||||
| Net Debt | 3,248 | |||||||||
| Equity Value | 3,302 | |||||||||
| Diluted Shares Outstanding, MM | 169 | |||||||||
| Equity Value Per Share | 19.55 |
What You Will Get
- Real Nordstrom Data: Preloaded financials – from revenue to EBIT – based on actual and projected figures for Nordstrom, Inc. (JWN).
- Full Customization: Adjust all critical parameters (yellow cells) like WACC, growth %, and tax rates to fit your analysis.
- Instant Valuation Updates: Automatic recalculations to analyze the impact of changes on Nordstrom’s fair value.
- Versatile Excel Template: Tailored for quick edits, scenario testing, and detailed projections specific to Nordstrom, Inc. (JWN).
- Time-Saving and Accurate: Skip building models from scratch while maintaining precision and flexibility in your financial assessments.
Key Features
- Accurate Nordstrom Financials: Gain access to reliable pre-loaded historical data and future projections for Nordstrom, Inc. (JWN).
- Customizable Forecast Assumptions: Modify highlighted cells to adjust key metrics like WACC, growth rates, and profit margins.
- Dynamic Calculations: Experience automatic updates for DCF, Net Present Value (NPV), and cash flow analysis.
- Visual Dashboard: Utilize easy-to-read charts and summaries for a clear visualization of your valuation outcomes.
- Designed for All Users: An intuitive layout tailored for investors, CFOs, and consultants, suitable for both professionals and novices.
How It Works
- Step 1: Download the Excel file.
- Step 2: Review pre-entered Nordstrom data (historical and projected).
- Step 3: Adjust key assumptions (yellow cells) based on your analysis.
- Step 4: View automatic recalculations for Nordstrom’s intrinsic value.
- Step 5: Use the outputs for investment decisions or reporting.
Why Choose This Calculator for Nordstrom, Inc. (JWN)?
- User-Friendly Interface: Perfect for both novices and seasoned analysts.
- Customizable Inputs: Adjust parameters to suit your financial evaluation.
- Real-Time Updates: Observe immediate changes in Nordstrom’s valuation as you tweak inputs.
- Preloaded Data: Comes with Nordstrom’s historical financial information for swift analysis.
- Preferred by Experts: Utilized by investors and financial analysts for well-informed decision-making.
Who Should Use This Product?
- Retail Management Students: Understand inventory management and customer engagement strategies using real-world examples.
- Researchers: Utilize Nordstrom's business model for case studies in retail and consumer behavior.
- Investors: Analyze your investment strategies and evaluate the performance of Nordstrom, Inc. (JWN).
- Market Analysts: Enhance your analysis with a detailed, customizable financial model tailored for retail companies.
- Entrepreneurs: Discover best practices from a leading retailer to apply in your own business ventures.
What the Template Contains
- Historical Data: Includes Nordstrom’s past financials and baseline forecasts.
- DCF and Levered DCF Models: Detailed templates to calculate Nordstrom’s intrinsic value.
- WACC Sheet: Pre-built calculations for Weighted Average Cost of Capital.
- Editable Inputs: Modify key drivers like growth rates, EBITDA %, and CAPEX assumptions.
- Quarterly and Annual Statements: A complete breakdown of Nordstrom’s financials.
- Interactive Dashboard: Visualize valuation results and projections dynamically.
Disclaimer
All information, articles, and product details provided on this website are for general informational and educational purposes only. We do not claim any ownership over, nor do we intend to infringe upon, any trademarks, copyrights, logos, brand names, or other intellectual property mentioned or depicted on this site. Such intellectual property remains the property of its respective owners, and any references here are made solely for identification or informational purposes, without implying any affiliation, endorsement, or partnership.
We make no representations or warranties, express or implied, regarding the accuracy, completeness, or suitability of any content or products presented. Nothing on this website should be construed as legal, tax, investment, financial, medical, or other professional advice. In addition, no part of this site—including articles or product references—constitutes a solicitation, recommendation, endorsement, advertisement, or offer to buy or sell any securities, franchises, or other financial instruments, particularly in jurisdictions where such activity would be unlawful.
All content is of a general nature and may not address the specific circumstances of any individual or entity. It is not a substitute for professional advice or services. Any actions you take based on the information provided here are strictly at your own risk. You accept full responsibility for any decisions or outcomes arising from your use of this website and agree to release us from any liability in connection with your use of, or reliance upon, the content or products found herein.