
|
Monday.com Ltd. (MNDY) تقييم DCF |
Fully Editable: Tailor To Your Needs In Excel Or Sheets
Professional Design: Trusted, Industry-Standard Templates
Investor-Approved Valuation Models
MAC/PC Compatible, Fully Unlocked
No Expertise Is Needed; Easy To Follow
monday.com Ltd. (MNDY) Bundle
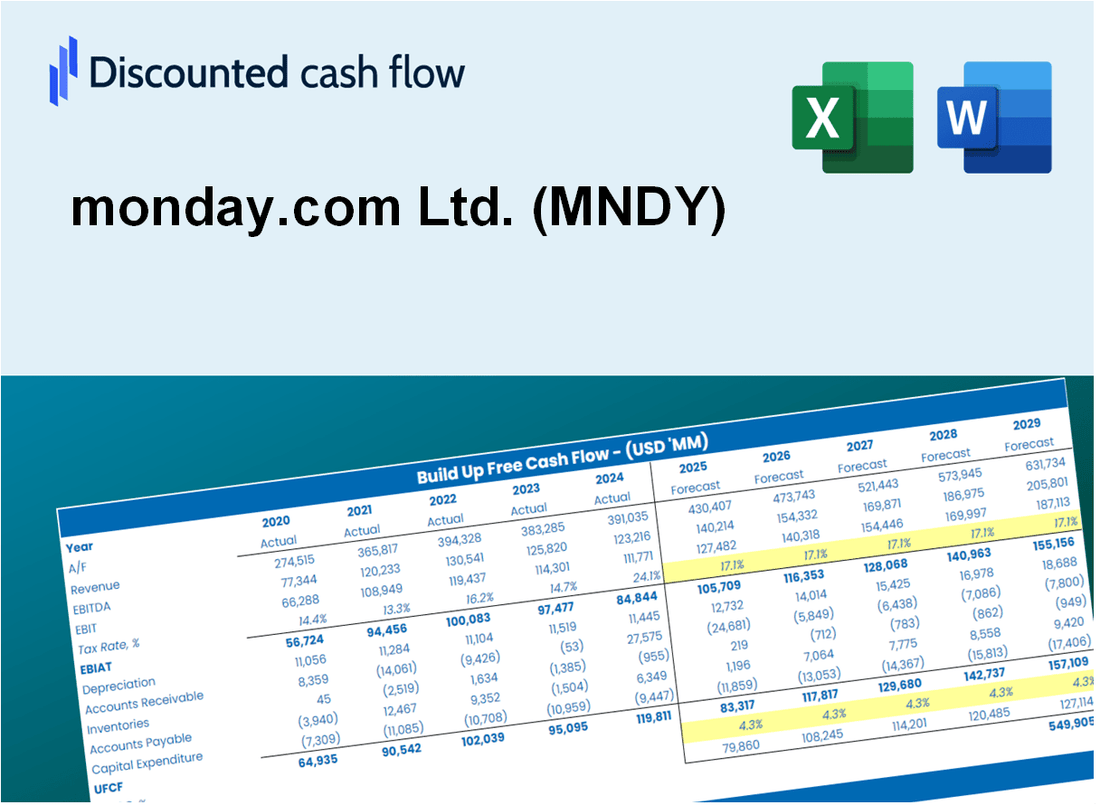
سواء كنت مستثمرًا أو محللًا ، فإن حاسبة DCF (MNDY) هذه هي موردك للتقييم الدقيق. محملة بالبيانات الحقيقية من Monday.com Ltd. ، يمكنك ضبط التوقعات ومراقبة التأثيرات في الوقت الفعلي.
Discounted Cash Flow (DCF) - (USD MM)
| Year | AY1 2020 |
AY2 2021 |
AY3 2022 |
AY4 2023 |
AY5 2024 |
FY1 2025 |
FY2 2026 |
FY3 2027 |
FY4 2028 |
FY5 2029 |
|---|---|---|---|---|---|---|---|---|---|---|
| Revenue | 161.1 | 308.2 | 519.0 | 729.7 | 972.0 | 1,539.3 | 2,437.9 | 3,860.8 | 6,114.4 | 9,683.4 |
| Revenue Growth, % | 0 | 91.25 | 68.43 | 40.59 | 33.21 | 58.37 | 58.37 | 58.37 | 58.37 | 58.37 |
| EBITDA | -147.1 | -123.9 | -120.1 | 12.8 | 58.0 | -452.4 | -716.4 | -1,134.6 | -1,796.9 | -2,845.8 |
| EBITDA, % | -91.3 | -40.22 | -23.14 | 1.75 | 5.97 | -29.39 | -29.39 | -29.39 | -29.39 | -29.39 |
| Depreciation | 1.9 | 2.7 | 8.6 | 9.0 | 18.2 | 21.0 | 33.3 | 52.7 | 83.5 | 132.2 |
| Depreciation, % | 1.17 | 0.89112 | 1.65 | 1.24 | 1.88 | 1.37 | 1.37 | 1.37 | 1.37 | 1.37 |
| EBIT | -149.0 | -126.7 | -128.7 | 3.8 | 39.8 | -473.4 | -749.7 | -1,187.3 | -1,880.4 | -2,978.0 |
| EBIT, % | -92.48 | -41.11 | -24.79 | 0.51652 | 4.09 | -30.75 | -30.75 | -30.75 | -30.75 | -30.75 |
| Total Cash | 139.8 | 886.8 | 885.9 | 1,116.1 | 1,461.6 | 1,498.6 | 2,373.4 | 3,758.7 | 5,952.7 | 9,427.2 |
| Total Cash, percent | .0 | .0 | .0 | .0 | .0 | .0 | .0 | .0 | .0 | .0 |
| Account Receivables | 3.9 | 8.7 | 17.1 | 28.7 | 32.3 | 48.7 | 77.1 | 122.1 | 193.4 | 306.3 |
| Account Receivables, % | 2.43 | 2.84 | 3.29 | 3.94 | 3.32 | 3.16 | 3.16 | 3.16 | 3.16 | 3.16 |
| Inventories | .0 | .0 | .0 | .0 | .0 | .0 | .0 | .0 | .0 | .0 |
| Inventories, % | 0 | 0 | 0 | 0 | 0 | 0 | 0 | 0 | 0 | 0 |
| Accounts Payable | 25.7 | 23.6 | 7.3 | 24.8 | 35.6 | 98.9 | 156.6 | 248.0 | 392.7 | 622.0 |
| Accounts Payable, % | 15.97 | 7.66 | 1.41 | 3.4 | 3.66 | 6.42 | 6.42 | 6.42 | 6.42 | 6.42 |
| Capital Expenditure | -5.5 | -13.8 | -19.0 | -10.5 | -15.2 | -44.7 | -70.8 | -112.2 | -177.7 | -281.4 |
| Capital Expenditure, % | -3.4 | -4.46 | -3.66 | -1.43 | -1.57 | -2.91 | -2.91 | -2.91 | -2.91 | -2.91 |
| Tax Rate, % | 6.08 | 6.08 | 6.08 | 6.08 | 6.08 | 6.08 | 6.08 | 6.08 | 6.08 | 6.08 |
| EBITAT | -151.2 | -129.0 | -136.0 | -2.1 | 37.3 | -373.0 | -590.7 | -935.4 | -1,481.5 | -2,346.2 |
| Depreciation | ||||||||||
| Changes in Account Receivables | ||||||||||
| Changes in Inventories | ||||||||||
| Changes in Accounts Payable | ||||||||||
| Capital Expenditure | ||||||||||
| UFCF | -132.9 | -147.0 | -171.1 | 2.3 | 47.6 | -349.9 | -598.9 | -948.5 | -1,502.2 | -2,379.0 |
| WACC, % | 9.49 | 9.49 | 9.49 | 9.45 | 9.49 | 9.48 | 9.48 | 9.48 | 9.48 | 9.48 |
| PV UFCF | ||||||||||
| SUM PV UFCF | -4,100.0 | |||||||||
| Long Term Growth Rate, % | 2.00 | |||||||||
| Free cash flow (T + 1) | -2,427 | |||||||||
| Terminal Value | -32,432 | |||||||||
| Present Terminal Value | -20,618 | |||||||||
| Enterprise Value | -24,718 | |||||||||
| Net Debt | -1,306 | |||||||||
| Equity Value | -23,413 | |||||||||
| Diluted Shares Outstanding, MM | 52 | |||||||||
| Equity Value Per Share | -446.63 |
What You Will Get
- Editable Excel Template: A fully customizable Excel-based DCF Calculator featuring pre-filled real MNDY financials.
- Real-World Data: Historical data and forward-looking estimates (as indicated in the highlighted cells).
- Forecast Flexibility: Adjust forecast assumptions such as revenue growth, EBITDA %, and WACC.
- Automatic Calculations: Instantly observe how your inputs affect monday.com’s valuation.
- Professional Tool: Designed for investors, CFOs, consultants, and financial analysts.
- User-Friendly Design: Organized for clarity and ease of use, complete with step-by-step instructions.
Key Features
- Comprehensive Project Management Tools: Offers a suite of customizable workflows to enhance team collaboration.
- Real-Time Collaboration: Features built-in communication tools for seamless team interaction and updates.
- Customizable Dashboards: Tailor your dashboard to display the most relevant metrics and project statuses.
- Automated Workflows: Streamline repetitive tasks with automation to improve efficiency.
- Integration Capabilities: Connect with various third-party applications to enhance functionality and data flow.
How It Works
- Download the Template: Gain immediate access to the Excel-based MNDY DCF Calculator.
- Input Your Assumptions: Modify the yellow-highlighted cells for growth rates, WACC, margins, and other variables.
- Instant Calculations: The model automatically recalculates monday.com’s intrinsic value.
- Test Scenarios: Experiment with different assumptions to assess potential valuation shifts.
- Analyze and Decide: Utilize the results to inform your investment or financial analysis.
Why Choose This Calculator?
- Accurate Data: Up-to-date monday.com financials guarantee trustworthy valuation outcomes.
- Customizable: Modify essential parameters such as growth rates, WACC, and tax rates to align with your forecasts.
- Time-Saving: Pre-configured calculations save you from building models from the ground up.
- Professional-Grade Tool: Tailored for investors, analysts, and consultants focused on monday.com (MNDY).
- User-Friendly: Easy-to-navigate design and clear instructions make it accessible for all users.
Who Should Use This Product?
- Project Managers: Streamline project workflows and enhance team collaboration using monday.com (MNDY).
- Marketing Teams: Track campaign progress and manage resources effectively with intuitive tools.
- Consultants and Advisors: Leverage monday.com (MNDY) to provide clients with tailored project management solutions.
- Students and Educators: Utilize the platform for group projects and to teach project management methodologies.
- Tech Enthusiasts: Explore innovative features that support agile methodologies and team productivity.
What the Template Contains
- Pre-Filled Data: Includes monday.com Ltd.'s historical financials and forecasts.
- Discounted Cash Flow Model: Editable DCF valuation model with automatic calculations.
- Weighted Average Cost of Capital (WACC): A dedicated sheet for calculating WACC based on custom inputs.
- Key Financial Ratios: Analyze monday.com Ltd.'s profitability, efficiency, and leverage.
- Customizable Inputs: Edit revenue growth, margins, and tax rates with ease.
- Clear Dashboard: Charts and tables summarizing key valuation results.
Disclaimer
All information, articles, and product details provided on this website are for general informational and educational purposes only. We do not claim any ownership over, nor do we intend to infringe upon, any trademarks, copyrights, logos, brand names, or other intellectual property mentioned or depicted on this site. Such intellectual property remains the property of its respective owners, and any references here are made solely for identification or informational purposes, without implying any affiliation, endorsement, or partnership.
We make no representations or warranties, express or implied, regarding the accuracy, completeness, or suitability of any content or products presented. Nothing on this website should be construed as legal, tax, investment, financial, medical, or other professional advice. In addition, no part of this site—including articles or product references—constitutes a solicitation, recommendation, endorsement, advertisement, or offer to buy or sell any securities, franchises, or other financial instruments, particularly in jurisdictions where such activity would be unlawful.
All content is of a general nature and may not address the specific circumstances of any individual or entity. It is not a substitute for professional advice or services. Any actions you take based on the information provided here are strictly at your own risk. You accept full responsibility for any decisions or outcomes arising from your use of this website and agree to release us from any liability in connection with your use of, or reliance upon, the content or products found herein.