
|
Marathon Petroleum Corporation (MPC) تقييم DCF |
Fully Editable: Tailor To Your Needs In Excel Or Sheets
Professional Design: Trusted, Industry-Standard Templates
Investor-Approved Valuation Models
MAC/PC Compatible, Fully Unlocked
No Expertise Is Needed; Easy To Follow
Marathon Petroleum Corporation (MPC) Bundle
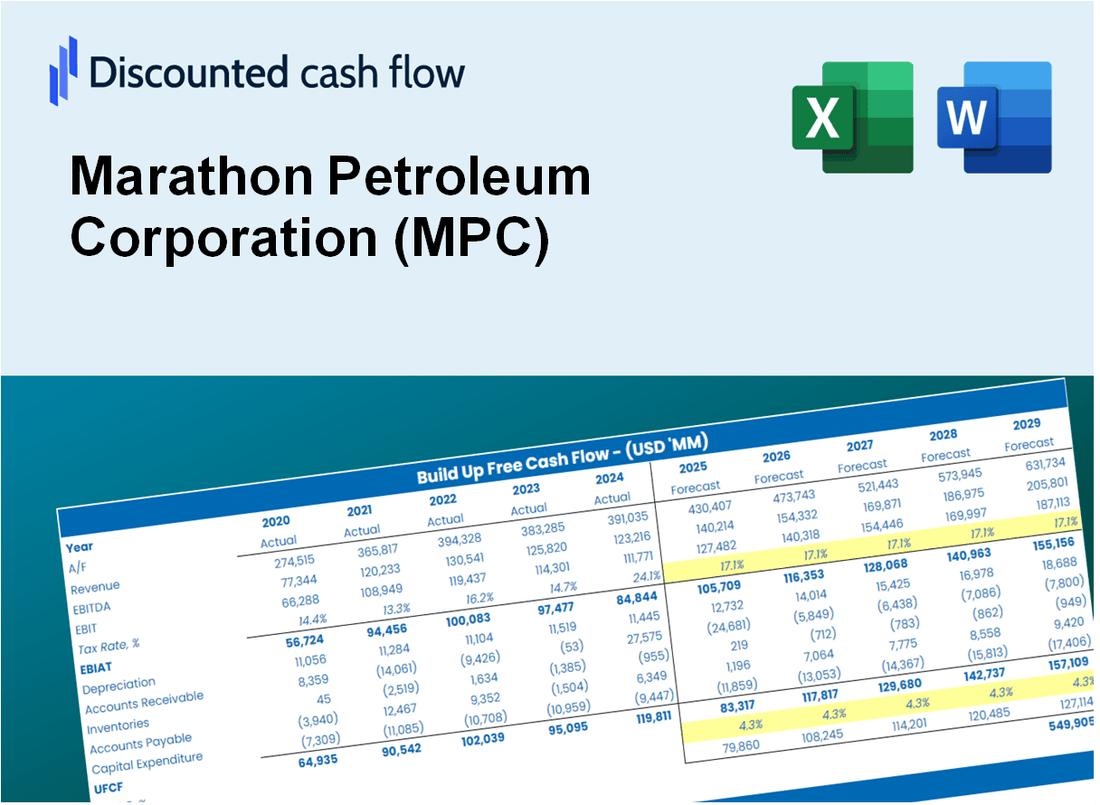
تبحث لتقييم القيمة الجوهرية لشركة ماراثون بترول؟ يدمج حاسبة DCF الخاصة بنا (MPC) بيانات العالم الحقيقي بميزات تخصيص شاملة ، مما يتيح لك تحسين توقعاتك واتخاذ خيارات استثمار أكثر استنارة.
What You Will Get
- Real Marathon Petroleum Data: Preloaded financials – from revenue to EBIT – based on actual and projected figures.
- Full Customization: Adjust all critical parameters (yellow cells) like WACC, growth %, and tax rates.
- Instant Valuation Updates: Automatic recalculations to analyze the impact of changes on Marathon Petroleum’s fair value.
- Versatile Excel Template: Tailored for quick edits, scenario testing, and detailed projections.
- Time-Saving and Accurate: Skip building models from scratch while maintaining precision and flexibility.
Key Features
- Real-Life MPC Data: Pre-filled with Marathon Petroleum’s historical financials and future projections.
- Fully Customizable Inputs: Modify revenue growth, profit margins, WACC, tax rates, and capital expenditures.
- Dynamic Valuation Model: Automatic updates to Net Present Value (NPV) and intrinsic value based on your adjustments.
- Scenario Testing: Generate multiple forecast scenarios to evaluate different valuation results.
- User-Friendly Design: Intuitive, organized, and crafted for both professionals and newcomers.
How It Works
- Step 1: Download the prebuilt Excel template with Marathon Petroleum Corporation's (MPC) data included.
- Step 2: Explore the pre-filled sheets to understand the key metrics relevant to (MPC).
- Step 3: Update forecasts and assumptions in the editable yellow cells (WACC, growth, margins) for (MPC).
- Step 4: Instantly view recalculated results, including Marathon Petroleum Corporation's (MPC) intrinsic value.
- Step 5: Make informed investment decisions or generate reports using the outputs for (MPC).
Why Choose This Calculator for Marathon Petroleum Corporation (MPC)?
- Accurate Data: Access to real Marathon Petroleum financials ensures dependable valuation outcomes.
- Customizable: Tailor essential parameters such as growth rates, WACC, and tax rates to align with your forecasts.
- Time-Saving: Pre-configured calculations save you the hassle of starting from the ground up.
- Professional-Grade Tool: Crafted for investors, analysts, and consultants in the energy sector.
- User-Friendly: An intuitive design and guided instructions make it accessible for all users.
Who Should Utilize Marathon Petroleum Corporation (MPC)?
- Investors: Gain insights into the energy sector with a reliable resource for investment decisions.
- Financial Analysts: Streamline your analysis with comprehensive data on petroleum market trends.
- Consultants: Easily modify reports and presentations tailored to client needs in the energy industry.
- Energy Enthusiasts: Enhance your knowledge of the petroleum sector through detailed case studies and reports.
- Educators and Students: Leverage it as a valuable educational resource in energy economics and finance courses.
What the Template Contains
- Pre-Filled DCF Model: Marathon Petroleum Corporation’s (MPC) financial data preloaded for immediate use.
- WACC Calculator: Detailed calculations for Weighted Average Cost of Capital.
- Financial Ratios: Evaluate Marathon Petroleum Corporation’s (MPC) profitability, leverage, and efficiency.
- Editable Inputs: Change assumptions such as growth, margins, and CAPEX to fit your scenarios.
- Financial Statements: Annual and quarterly reports to support detailed analysis.
- Interactive Dashboard: Easily visualize key valuation metrics and results.
Disclaimer
All information, articles, and product details provided on this website are for general informational and educational purposes only. We do not claim any ownership over, nor do we intend to infringe upon, any trademarks, copyrights, logos, brand names, or other intellectual property mentioned or depicted on this site. Such intellectual property remains the property of its respective owners, and any references here are made solely for identification or informational purposes, without implying any affiliation, endorsement, or partnership.
We make no representations or warranties, express or implied, regarding the accuracy, completeness, or suitability of any content or products presented. Nothing on this website should be construed as legal, tax, investment, financial, medical, or other professional advice. In addition, no part of this site—including articles or product references—constitutes a solicitation, recommendation, endorsement, advertisement, or offer to buy or sell any securities, franchises, or other financial instruments, particularly in jurisdictions where such activity would be unlawful.
All content is of a general nature and may not address the specific circumstances of any individual or entity. It is not a substitute for professional advice or services. Any actions you take based on the information provided here are strictly at your own risk. You accept full responsibility for any decisions or outcomes arising from your use of this website and agree to release us from any liability in connection with your use of, or reliance upon, the content or products found herein.