
|
Myriad Genetics ، Inc. (MYGN) DCF تقييم |
Fully Editable: Tailor To Your Needs In Excel Or Sheets
Professional Design: Trusted, Industry-Standard Templates
Investor-Approved Valuation Models
MAC/PC Compatible, Fully Unlocked
No Expertise Is Needed; Easy To Follow
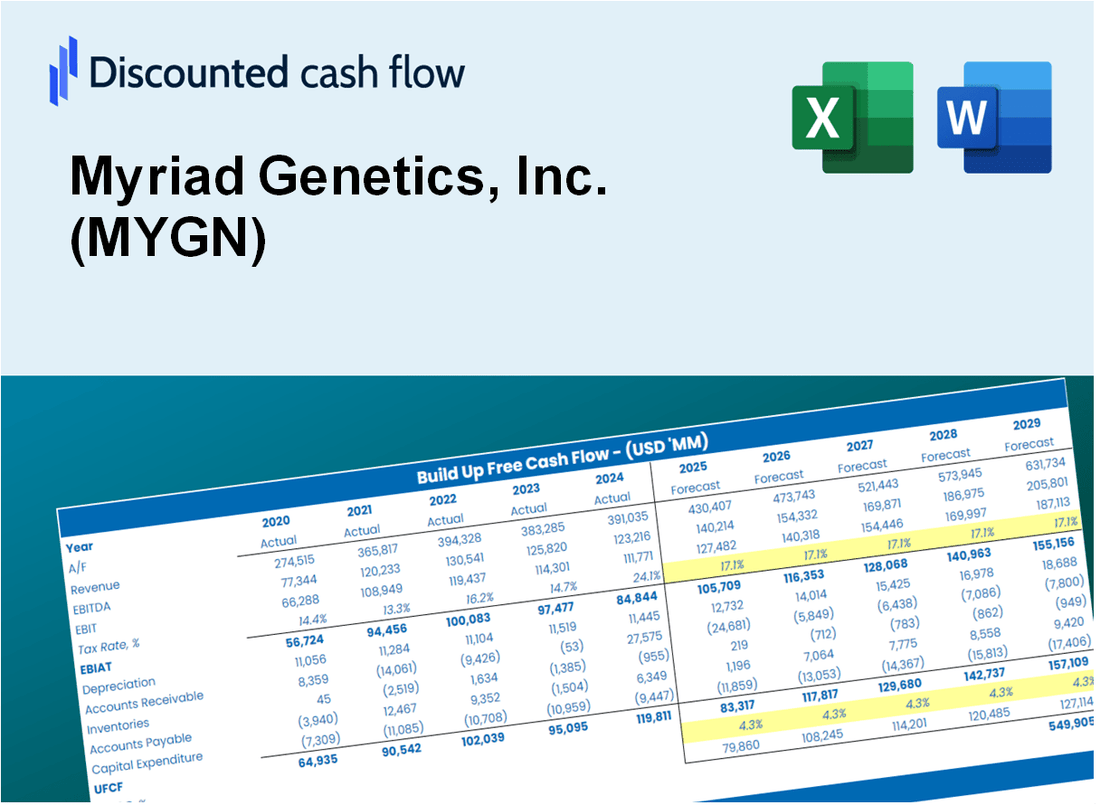
Myriad Genetics, Inc. (MYGN) Bundle
المصمم من أجل الدقة ، تمكنك حاسبة MYGN (Myriad Genetics ، Inc.
What You Will Get
- Editable Forecast Inputs: Easily adjust assumptions (growth %, margins, WACC) to explore various scenarios.
- Real-World Data: Myriad Genetics, Inc.’s (MYGN) financial data pre-filled to kickstart your analysis.
- Automatic DCF Outputs: The template computes Net Present Value (NPV) and intrinsic value for you.
- Customizable and Professional: A refined Excel model that tailors to your valuation requirements.
- Built for Analysts and Investors: Perfect for testing projections, validating strategies, and enhancing efficiency.
Key Features
- Accurate Myriad Genetics Financials: Access reliable pre-loaded historical data and future projections for MYGN.
- Customizable Forecast Assumptions: Modify highlighted cells for key metrics like WACC, growth rates, and profit margins.
- Dynamic Calculations: Automatic updates for DCF, Net Present Value (NPV), and cash flow analysis tailored for MYGN.
- Visual Dashboard: User-friendly charts and summaries to help visualize your valuation outcomes.
- For All Skill Levels: A straightforward, intuitive design suitable for investors, CFOs, and consultants alike.
How It Works
- 1. Access the Template: Download and open the Excel file featuring Myriad Genetics, Inc. (MYGN) preloaded data.
- 2. Modify Assumptions: Adjust key inputs such as growth rates, WACC, and capital expenditures to fit your analysis.
- 3. View Results Instantly: The DCF model automatically calculates intrinsic value and NPV based on your inputs.
- 4. Explore Scenarios: Evaluate various forecasts to understand different valuation outcomes for Myriad Genetics, Inc. (MYGN).
- 5. Present with Assurance: Share professional valuation insights to enhance your decision-making process.
Why Choose This Calculator?
- Comprehensive Tool: Offers DCF, WACC, and financial ratio analyses all in one solution.
- Customizable Inputs: Modify the yellow-highlighted cells to explore different scenarios.
- Detailed Insights: Automatically computes Myriad Genetics’ intrinsic value and Net Present Value.
- Preloaded Data: Historical and forecasted information provides reliable starting points.
- Professional Quality: Perfect for financial analysts, investors, and business consultants.
Who Should Use This Product?
- Investors: Evaluate Myriad Genetics’ valuation prior to making stock transactions.
- CFOs and Financial Analysts: Optimize valuation methodologies and validate forecasts.
- Startup Founders: Understand the valuation strategies of established biotech firms like Myriad Genetics.
- Consultants: Provide comprehensive valuation reports for clients in the healthcare sector.
- Students and Educators: Utilize real-time data to practice and teach valuation principles.
What the Template Contains
- Preloaded MYGN Data: Historical and projected financial data, including revenue, EBIT, and capital expenditures.
- DCF and WACC Models: Professional-grade sheets for calculating intrinsic value and Weighted Average Cost of Capital.
- Editable Inputs: Yellow-highlighted cells for adjusting revenue growth, tax rates, and discount rates.
- Financial Statements: Comprehensive annual and quarterly financials for deeper analysis.
- Key Ratios: Profitability, leverage, and efficiency ratios to evaluate performance.
- Dashboard and Charts: Visual summaries of valuation outcomes and assumptions.
Disclaimer
All information, articles, and product details provided on this website are for general informational and educational purposes only. We do not claim any ownership over, nor do we intend to infringe upon, any trademarks, copyrights, logos, brand names, or other intellectual property mentioned or depicted on this site. Such intellectual property remains the property of its respective owners, and any references here are made solely for identification or informational purposes, without implying any affiliation, endorsement, or partnership.
We make no representations or warranties, express or implied, regarding the accuracy, completeness, or suitability of any content or products presented. Nothing on this website should be construed as legal, tax, investment, financial, medical, or other professional advice. In addition, no part of this site—including articles or product references—constitutes a solicitation, recommendation, endorsement, advertisement, or offer to buy or sell any securities, franchises, or other financial instruments, particularly in jurisdictions where such activity would be unlawful.
All content is of a general nature and may not address the specific circumstances of any individual or entity. It is not a substitute for professional advice or services. Any actions you take based on the information provided here are strictly at your own risk. You accept full responsibility for any decisions or outcomes arising from your use of this website and agree to release us from any liability in connection with your use of, or reliance upon, the content or products found herein.