
|
PLDT Inc. (PHI) تقييم DCF |
Fully Editable: Tailor To Your Needs In Excel Or Sheets
Professional Design: Trusted, Industry-Standard Templates
Investor-Approved Valuation Models
MAC/PC Compatible, Fully Unlocked
No Expertise Is Needed; Easy To Follow
PLDT Inc. (PHI) Bundle
تقييم PLDT Inc. التوقعات المالية مثل خبير! توفر حاسبة DCF (PHI) هذه البيانات المالية المليئة مسبقًا وتوفر مرونة تامة لتعديل نمو الإيرادات ، WACC ، الهوامش ، وغيرها من الافتراضات الحاسمة التي تتماشى مع توقعاتك.
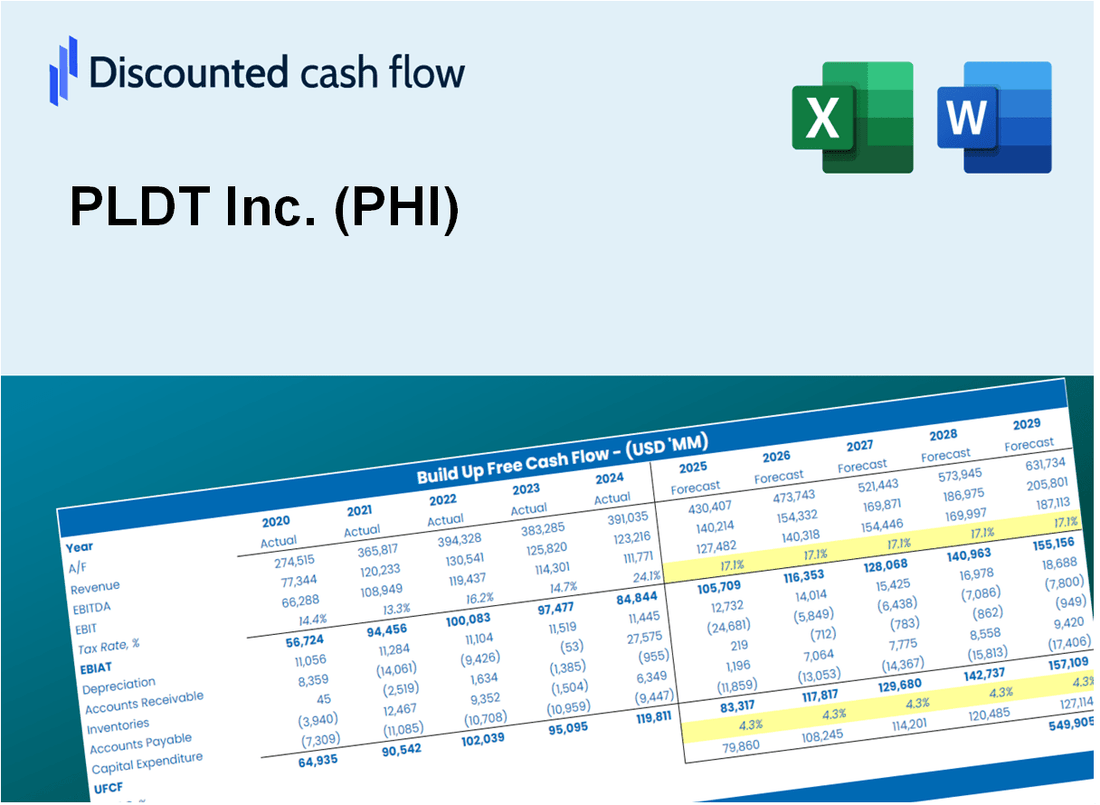
Discounted Cash Flow (DCF) - (USD MM)
| Year | AY1 2020 |
AY2 2021 |
AY3 2022 |
AY4 2023 |
AY5 2024 |
FY1 2025 |
FY2 2026 |
FY3 2027 |
FY4 2028 |
FY5 2029 |
|---|---|---|---|---|---|---|---|---|---|---|
| Revenue | 3,059.3 | 3,266.4 | 3,469.0 | 3,565.5 | 3,664.9 | 3,834.8 | 4,012.5 | 4,198.5 | 4,393.1 | 4,596.7 |
| Revenue Growth, % | 0 | 6.77 | 6.2 | 2.78 | 2.79 | 4.64 | 4.64 | 4.64 | 4.64 | 4.64 |
| EBITDA | 1,571.9 | 1,682.5 | 1,781.9 | 1,839.3 | 1,932.6 | 1,983.2 | 2,075.1 | 2,171.3 | 2,271.9 | 2,377.2 |
| EBITDA, % | 51.38 | 51.51 | 51.37 | 51.59 | 52.73 | 51.72 | 51.72 | 51.72 | 51.72 | 51.72 |
| Depreciation | 844.7 | 929.5 | 1,670.9 | 991.9 | 950.4 | 1,211.6 | 1,267.8 | 1,326.6 | 1,388.1 | 1,452.4 |
| Depreciation, % | 27.61 | 28.45 | 48.17 | 27.82 | 25.93 | 31.6 | 31.6 | 31.6 | 31.6 | 31.6 |
| EBIT | 727.3 | 753.0 | 111.0 | 847.5 | 982.2 | 771.5 | 807.3 | 844.7 | 883.9 | 924.8 |
| EBIT, % | 23.77 | 23.05 | 3.2 | 23.77 | 26.8 | 20.12 | 20.12 | 20.12 | 20.12 | 20.12 |
| Total Cash | 820.9 | 564.8 | 436.1 | 288.8 | 186.0 | 535.9 | 560.7 | 586.7 | 613.9 | 642.3 |
| Total Cash, percent | .0 | .0 | .0 | .0 | .0 | .0 | .0 | .0 | .0 | .0 |
| Account Receivables | 403.1 | 396.8 | 470.3 | 464.3 | 558.0 | 514.9 | 538.7 | 563.7 | 589.8 | 617.2 |
| Account Receivables, % | 13.18 | 12.15 | 13.56 | 13.02 | 15.23 | 13.43 | 13.43 | 13.43 | 13.43 | 13.43 |
| Inventories | 69.0 | 61.9 | 60.3 | 56.5 | 55.9 | 69.0 | 72.2 | 75.6 | 79.1 | 82.7 |
| Inventories, % | 2.26 | 1.89 | 1.74 | 1.58 | 1.52 | 1.8 | 1.8 | 1.8 | 1.8 | 1.8 |
| Accounts Payable | 1,312.5 | 1,481.3 | 1,704.8 | 1,262.4 | 1,032.8 | 1,541.4 | 1,612.9 | 1,687.6 | 1,765.9 | 1,847.7 |
| Accounts Payable, % | 42.9 | 45.35 | 49.14 | 35.41 | 28.18 | 40.2 | 40.2 | 40.2 | 40.2 | 40.2 |
| Capital Expenditure | -1,320.0 | -1,757.4 | -1,615.0 | -1,325.7 | -1,154.2 | -1,627.3 | -1,702.7 | -1,781.7 | -1,864.3 | -1,950.7 |
| Capital Expenditure, % | -43.15 | -53.8 | -46.55 | -37.18 | -31.49 | -42.44 | -42.44 | -42.44 | -42.44 | -42.44 |
| Tax Rate, % | 24.33 | 24.33 | 24.33 | 24.33 | 24.33 | 24.33 | 24.33 | 24.33 | 24.33 | 24.33 |
| EBITAT | 534.8 | 581.3 | 86.2 | 618.3 | 743.3 | 581.7 | 608.7 | 636.9 | 666.4 | 697.3 |
| Depreciation | ||||||||||
| Changes in Account Receivables | ||||||||||
| Changes in Inventories | ||||||||||
| Changes in Accounts Payable | ||||||||||
| Capital Expenditure | ||||||||||
| UFCF | 899.8 | -64.2 | 293.6 | -148.1 | 216.8 | 704.7 | 218.1 | 228.2 | 238.8 | 249.9 |
| WACC, % | 4.62 | 4.72 | 4.73 | 4.61 | 4.68 | 4.67 | 4.67 | 4.67 | 4.67 | 4.67 |
| PV UFCF | ||||||||||
| SUM PV UFCF | 1,469.2 | |||||||||
| Long Term Growth Rate, % | 2.00 | |||||||||
| Free cash flow (T + 1) | 255 | |||||||||
| Terminal Value | 9,542 | |||||||||
| Present Terminal Value | 7,594 | |||||||||
| Enterprise Value | 9,063 | |||||||||
| Net Debt | 5,503 | |||||||||
| Equity Value | 3,560 | |||||||||
| Diluted Shares Outstanding, MM | 216 | |||||||||
| Equity Value Per Share | 16.48 |
What You Will Get
- Real PLDT Financials: Access to historical and projected data for precise valuation.
- Customizable Inputs: Adjust WACC, tax rates, revenue growth, and capital expenditures as needed.
- Dynamic Calculations: Intrinsic value and NPV are computed in real-time.
- Scenario Analysis: Evaluate various scenarios to assess PLDT Inc.'s future performance.
- User-Friendly Design: Designed for professionals while remaining approachable for newcomers.
Key Features
- Customizable Financial Inputs: Adjust essential parameters such as revenue growth, EBITDA %, and capital expenditures.
- Instant DCF Valuation: Quickly computes intrinsic value, NPV, and other financial metrics.
- High-Precision Accuracy: Leverages PLDT Inc.'s (PHI) actual financial data for credible valuation results.
- Effortless Scenario Analysis: Easily explore various assumptions and evaluate their impacts.
- Efficiency Booster: Avoid the complexities of creating detailed valuation models from the ground up.
How It Works
- Step 1: Download the prebuilt Excel template featuring PLDT Inc.'s (PHI) data.
- Step 2: Navigate through the pre-filled sheets to familiarize yourself with the key metrics.
- Step 3: Modify forecasts and assumptions in the editable yellow cells (WACC, growth, margins).
- Step 4: Instantly view updated results, including PLDT Inc.'s (PHI) intrinsic value.
- Step 5: Make well-informed investment decisions or create reports based on the outputs.
Why Choose This Calculator for PLDT Inc. (PHI)?
- All-in-One Solution: Combines DCF, WACC, and financial ratio analyses tailored for PLDT Inc. (PHI).
- Adjustable Parameters: Modify the yellow-highlighted cells to explore different financial scenarios.
- In-Depth Analysis: Automatically computes PLDT Inc.’s (PHI) intrinsic value and Net Present Value.
- Integrated Data: Historical and projected data provide reliable foundations for analysis.
- Expert-Level Tool: Perfect for financial analysts, investors, and business consultants focusing on PLDT Inc. (PHI).
Who Should Use PLDT Inc. (PHI)?
- Investors: Make informed investment choices with a reliable telecommunications service provider.
- Market Analysts: Streamline your research with comprehensive data on network coverage and performance.
- Consultants: Easily tailor reports and presentations to showcase PLDT's market position and offerings.
- Telecom Enthusiasts: Enhance your knowledge of the telecommunications sector through detailed insights and case studies.
- Educators and Students: Utilize PLDT Inc. (PHI) as a case study in telecommunications and business courses.
What the Template Contains
- Operating and Balance Sheet Data: Pre-filled PLDT Inc. (PHI) historical data and forecasts, including revenue, EBITDA, EBIT, and capital expenditures.
- WACC Calculation: A dedicated sheet for Weighted Average Cost of Capital (WACC), including parameters like Beta, risk-free rate, and share price.
- DCF Valuation (Unlevered and Levered): Editable Discounted Cash Flow models showing intrinsic value with detailed calculations.
- Financial Statements: Pre-loaded financial statements (annual and quarterly) to support analysis.
- Key Ratios: Includes profitability, leverage, and efficiency ratios for PLDT Inc. (PHI).
- Dashboard and Charts: Visual summary of valuation outputs and assumptions to analyze results easily.
Disclaimer
All information, articles, and product details provided on this website are for general informational and educational purposes only. We do not claim any ownership over, nor do we intend to infringe upon, any trademarks, copyrights, logos, brand names, or other intellectual property mentioned or depicted on this site. Such intellectual property remains the property of its respective owners, and any references here are made solely for identification or informational purposes, without implying any affiliation, endorsement, or partnership.
We make no representations or warranties, express or implied, regarding the accuracy, completeness, or suitability of any content or products presented. Nothing on this website should be construed as legal, tax, investment, financial, medical, or other professional advice. In addition, no part of this site—including articles or product references—constitutes a solicitation, recommendation, endorsement, advertisement, or offer to buy or sell any securities, franchises, or other financial instruments, particularly in jurisdictions where such activity would be unlawful.
All content is of a general nature and may not address the specific circumstances of any individual or entity. It is not a substitute for professional advice or services. Any actions you take based on the information provided here are strictly at your own risk. You accept full responsibility for any decisions or outcomes arising from your use of this website and agree to release us from any liability in connection with your use of, or reliance upon, the content or products found herein.