
|
Snowflake Inc. (Snow) DCF تقييم |
Fully Editable: Tailor To Your Needs In Excel Or Sheets
Professional Design: Trusted, Industry-Standard Templates
Investor-Approved Valuation Models
MAC/PC Compatible, Fully Unlocked
No Expertise Is Needed; Easy To Follow
Snowflake Inc. (SNOW) Bundle
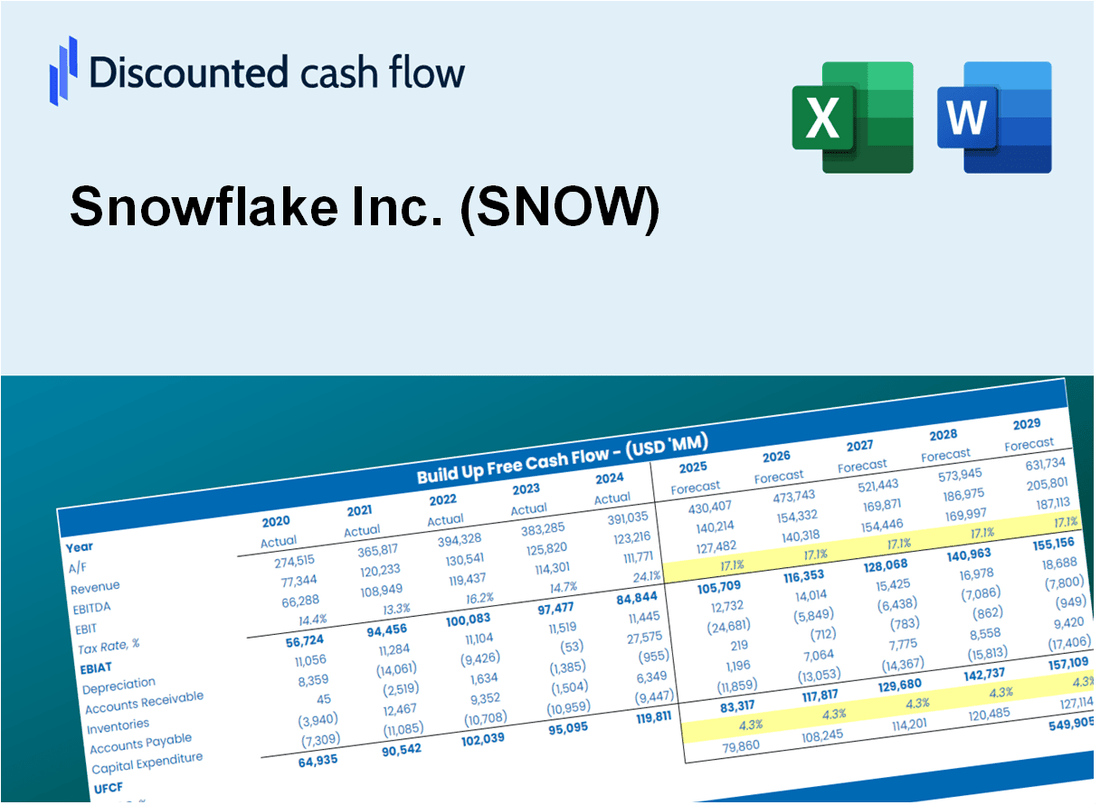
عزز استراتيجيات الاستثمار الخاصة بك مع حاسبة DCF Snow Snowflake (SNOW)! راجع البيانات المالية الحقيقية للثلوج للثلوج ، وضبط توقعات النمو والنفقات ، ولاحظ على الفور كيفية تأثير هذه التعديلات على القيمة الجوهرية لشركة Snowflake Inc. (SNOW).
What You Will Get
- Real SNOW Financial Data: Pre-filled with Snowflake Inc.’s historical and projected data for precise analysis.
- Fully Editable Template: Modify key inputs like revenue growth, WACC, and EBITDA % with ease.
- Automatic Calculations: See Snowflake Inc.’s intrinsic value update instantly based on your changes.
- Professional Valuation Tool: Designed for investors, analysts, and consultants seeking accurate DCF results.
- User-Friendly Design: Simple structure and clear instructions for all experience levels.
Key Features
- 🔍 Real-Life SNOW Financials: Pre-filled historical and projected data for Snowflake Inc.
- ✏️ Fully Customizable Inputs: Adjust all critical parameters (yellow cells) like WACC, growth %, and tax rates.
- 📊 Professional DCF Valuation: Built-in formulas calculate Snowflake’s intrinsic value using the Discounted Cash Flow method.
- ⚡ Instant Results: Visualize Snowflake’s valuation instantly after making changes.
- Scenario Analysis: Test and compare outcomes for various financial assumptions side-by-side.
How It Works
- 1. Access the Template: Download and open the Excel file containing Snowflake Inc.'s (SNOW) preloaded data.
- 2. Adjust Assumptions: Modify key inputs such as growth rates, WACC, and capital expenditures.
- 3. View Results Instantly: The DCF model automatically computes intrinsic value and NPV.
- 4. Explore Scenarios: Analyze various forecasts to evaluate different valuation results.
- 5. Present with Confidence: Share professional valuation insights to inform your decision-making.
Why Choose This Calculator for Snowflake Inc. (SNOW)?
- All-in-One Solution: Combines DCF, WACC, and financial ratio analyses tailored for Snowflake.
- Flexible Inputs: Modify the highlighted cells to explore different financial scenarios.
- In-Depth Analysis: Automatically computes Snowflake’s intrinsic value and Net Present Value.
- Integrated Data: Utilizes both historical and projected data for precise calculations.
- Expert-Level Tool: Perfect for financial analysts, investors, and business strategists focusing on Snowflake.
Who Should Use Snowflake Inc. (SNOW)?
- Data Engineers: Streamline data workflows with a robust cloud data platform.
- Business Analysts: Gain insights faster with powerful data analytics tools.
- IT Professionals: Easily manage and scale data infrastructure without the hassle.
- Developers: Build and deploy applications using a flexible and efficient data architecture.
- Organizations of All Sizes: Leverage Snowflake's capabilities to enhance data-driven decision-making.
What the Template Contains
- Pre-Filled DCF Model: Snowflake Inc.’s (SNOW) financial data preloaded for immediate use.
- WACC Calculator: Detailed calculations for Weighted Average Cost of Capital.
- Financial Ratios: Evaluate Snowflake Inc.’s (SNOW) profitability, leverage, and efficiency.
- Editable Inputs: Change assumptions such as growth, margins, and CAPEX to fit your scenarios.
- Financial Statements: Annual and quarterly reports to support detailed analysis.
- Interactive Dashboard: Easily visualize key valuation metrics and results.
Disclaimer
All information, articles, and product details provided on this website are for general informational and educational purposes only. We do not claim any ownership over, nor do we intend to infringe upon, any trademarks, copyrights, logos, brand names, or other intellectual property mentioned or depicted on this site. Such intellectual property remains the property of its respective owners, and any references here are made solely for identification or informational purposes, without implying any affiliation, endorsement, or partnership.
We make no representations or warranties, express or implied, regarding the accuracy, completeness, or suitability of any content or products presented. Nothing on this website should be construed as legal, tax, investment, financial, medical, or other professional advice. In addition, no part of this site—including articles or product references—constitutes a solicitation, recommendation, endorsement, advertisement, or offer to buy or sell any securities, franchises, or other financial instruments, particularly in jurisdictions where such activity would be unlawful.
All content is of a general nature and may not address the specific circumstances of any individual or entity. It is not a substitute for professional advice or services. Any actions you take based on the information provided here are strictly at your own risk. You accept full responsibility for any decisions or outcomes arising from your use of this website and agree to release us from any liability in connection with your use of, or reliance upon, the content or products found herein.