
|
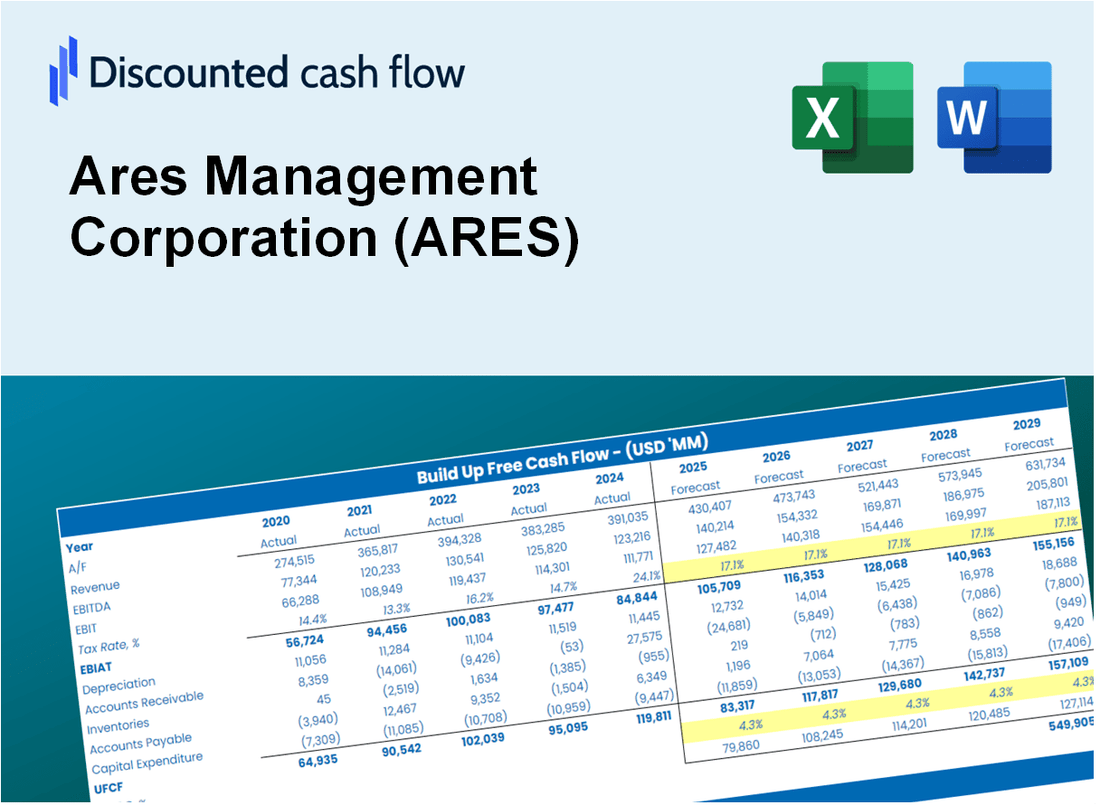
DCF -Bewertung der ARES Management Corporation (ARES) |
Fully Editable: Tailor To Your Needs In Excel Or Sheets
Professional Design: Trusted, Industry-Standard Templates
Investor-Approved Valuation Models
MAC/PC Compatible, Fully Unlocked
No Expertise Is Needed; Easy To Follow
Ares Management Corporation (ARES) Bundle
Erforschen Sie den finanziellen Ausblick von ARES Management Corporation (ARES) mit unserem benutzerfreundlichen DCF-Taschenrechner! Geben Sie Ihre Prognosen für Wachstum, Margen und Ausgaben ein, um den intrinsischen Wert der ARES Management Corporation (ARES) zu bestimmen und Ihren Investitionsansatz zu gestalten.
What You Will Get
- Real Ares Management Data: Preloaded financials – from revenue to EBIT – based on actual and projected figures for Ares Management Corporation (ARES).
- Full Customization: Adjust all critical parameters (yellow cells) like WACC, growth %, and tax rates to fit Ares Management Corporation (ARES).
- Instant Valuation Updates: Automatic recalculations to analyze the impact of changes on Ares Management Corporation’s (ARES) fair value.
- Versatile Excel Template: Tailored for quick edits, scenario testing, and detailed projections specific to Ares Management Corporation (ARES).
- Time-Saving and Accurate: Skip building models from scratch while maintaining precision and flexibility for Ares Management Corporation (ARES).
Key Features
- Customizable Investment Metrics: Adjust essential factors such as asset allocation, return rates, and risk assessments.
- Instant Portfolio Valuation: Quickly computes net asset value, internal rate of return, and other key metrics.
- High-Precision Analytics: Leverages Ares Management's actual financial data for accurate investment insights.
- Effortless Scenario Testing: Evaluate various investment strategies and analyze results with ease.
- Efficiency Booster: Streamline the process by avoiding the creation of intricate investment models from the ground up.
How It Works
- Download: Obtain the pre-built Excel file containing Ares Management Corporation's (ARES) financial data.
- Customize: Modify forecasts, including revenue growth, EBITDA %, and WACC as per your analysis.
- Update Automatically: The intrinsic value and NPV calculations refresh in real-time for accurate insights.
- Test Scenarios: Generate various projections and instantly compare the results.
- Make Decisions: Leverage the valuation findings to inform your investment approach.
Why Choose This Calculator for Ares Management Corporation (ARES)?
- User-Friendly Interface: Tailored for both novices and seasoned professionals.
- Customizable Inputs: Adjust parameters easily to suit your financial analysis.
- Real-Time Valuation: Watch Ares Management's valuation update instantly as you change inputs.
- Preloaded Data: Comes equipped with Ares Management's current financial metrics for swift evaluation.
- Preferred by Experts: Utilized by investors and analysts for making strategic decisions.
Who Should Use This Product?
- Finance Students: Explore investment strategies and analyze market trends using Ares Management Corporation (ARES) data.
- Academics: Integrate advanced financial models into your studies or research projects related to asset management.
- Investors: Evaluate your investment strategies and assess the performance metrics of Ares Management Corporation (ARES).
- Analysts: Enhance your analysis process with a tailored, ready-to-use financial model for Ares Management Corporation (ARES).
- Small Business Owners: Understand how large asset management firms like Ares Management Corporation (ARES) operate and make investment decisions.
What the Ares Management Corporation Template Contains
- Pre-Filled Data: Contains Ares Management Corporation’s historical financials and projections.
- Discounted Cash Flow Model: Editable DCF valuation model featuring automatic calculations.
- Weighted Average Cost of Capital (WACC): A dedicated sheet for calculating WACC using custom inputs.
- Key Financial Ratios: Evaluate Ares Management Corporation’s profitability, efficiency, and leverage.
- Customizable Inputs: Easily modify revenue growth, margins, and tax rates.
- Clear Dashboard: Visual representations and tables summarizing essential valuation outcomes.
Disclaimer
All information, articles, and product details provided on this website are for general informational and educational purposes only. We do not claim any ownership over, nor do we intend to infringe upon, any trademarks, copyrights, logos, brand names, or other intellectual property mentioned or depicted on this site. Such intellectual property remains the property of its respective owners, and any references here are made solely for identification or informational purposes, without implying any affiliation, endorsement, or partnership.
We make no representations or warranties, express or implied, regarding the accuracy, completeness, or suitability of any content or products presented. Nothing on this website should be construed as legal, tax, investment, financial, medical, or other professional advice. In addition, no part of this site—including articles or product references—constitutes a solicitation, recommendation, endorsement, advertisement, or offer to buy or sell any securities, franchises, or other financial instruments, particularly in jurisdictions where such activity would be unlawful.
All content is of a general nature and may not address the specific circumstances of any individual or entity. It is not a substitute for professional advice or services. Any actions you take based on the information provided here are strictly at your own risk. You accept full responsibility for any decisions or outcomes arising from your use of this website and agree to release us from any liability in connection with your use of, or reliance upon, the content or products found herein.