
|
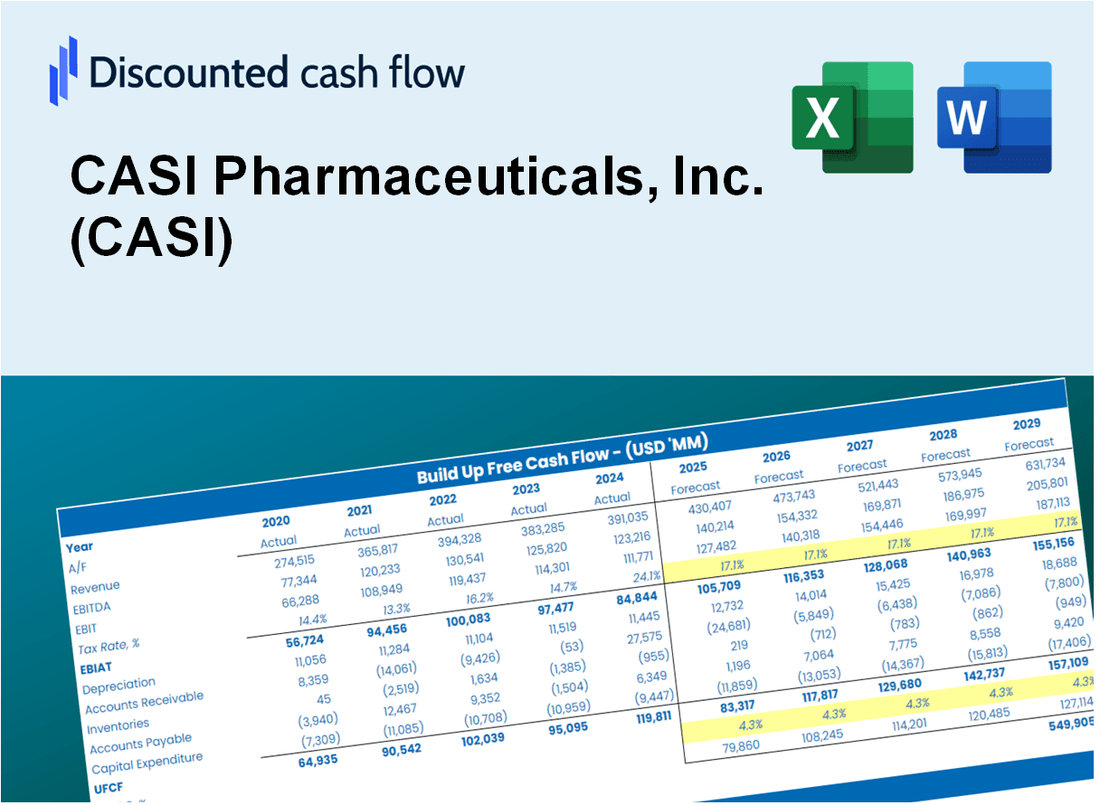
CASI Pharmaceuticals, Inc. (CASI) DCF -Bewertung |
Fully Editable: Tailor To Your Needs In Excel Or Sheets
Professional Design: Trusted, Industry-Standard Templates
Investor-Approved Valuation Models
MAC/PC Compatible, Fully Unlocked
No Expertise Is Needed; Easy To Follow
CASI Pharmaceuticals, Inc. (CASI) Bundle
Unser DCF -Taschenrechner von CASI (CASI) für Genauigkeit ermöglicht es Ihnen, die Bewertung von CASI Pharmaceuticals, Inc. unter Verwendung der tatsächlichen Finanzdaten zu bewerten, und bietet vollständige Flexibilität, um alle wesentlichen Parameter für verbesserte Projektionen zu ändern.
What You Will Get
- Real CASI Financials: Access to historical and projected data for precise valuation.
- Adjustable Inputs: Customize WACC, tax rates, revenue growth, and capital expenditures.
- Automatic Calculations: Intrinsic value and NPV are computed in real-time.
- Scenario Analysis: Evaluate various scenarios to assess CASI's future performance.
- Clear and Intuitive Design: Designed for professionals but easy for beginners to navigate.
Key Features
- Comprehensive CASI Data: Pre-filled with CASI Pharmaceuticals' historical performance metrics and future growth projections.
- Customizable Financial Inputs: Modify revenue growth rates, profit margins, discount rates, tax assumptions, and capital investments.
- Interactive Valuation Model: Real-time updates to Net Present Value (NPV) and intrinsic value based on user-defined parameters.
- Flexible Scenario Analysis: Develop various forecasting scenarios to explore different valuation possibilities.
- Intuitive User Interface: Clean, organized layout designed for both seasoned professionals and newcomers.
How It Works
- Download: Obtain the ready-to-use Excel file featuring CASI Pharmaceuticals, Inc. (CASI) financial data.
- Customize: Modify forecasts, including revenue growth, EBITDA %, and WACC.
- Update Automatically: The intrinsic value and NPV calculations refresh in real-time.
- Test Scenarios: Develop multiple projections and instantly compare outcomes.
- Make Decisions: Leverage the valuation results to inform your investment strategy.
Why Choose This Calculator for CASI Pharmaceuticals, Inc. (CASI)?
- User-Friendly Interface: Tailored for both novices and seasoned professionals.
- Customizable Inputs: Easily adjust parameters to suit your specific analysis.
- Real-Time Adjustments: Observe immediate updates to CASI's valuation as you change inputs.
- Pre-Loaded Data: Comes with CASI's actual financial metrics for swift evaluations.
- Relied Upon by Experts: Utilized by investors and analysts for informed decision-making.
Who Should Use This Product?
- Investors: Accurately estimate CASI Pharmaceuticals, Inc.'s (CASI) fair value before making investment decisions.
- CFOs: Utilize a professional-grade DCF model for financial reporting and analysis specific to CASI.
- Consultants: Quickly tailor the template for valuation reports focused on CASI for clients.
- Entrepreneurs: Gain insights into financial modeling techniques applied by leading pharmaceutical companies.
- Educators: Employ it as a teaching resource to illustrate valuation methodologies in the pharmaceutical sector.
What the Template Contains
- Historical Data: Includes CASI Pharmaceuticals, Inc.'s (CASI) past financials and baseline forecasts.
- DCF and Levered DCF Models: Detailed templates to calculate CASI's intrinsic value.
- WACC Sheet: Pre-built calculations for Weighted Average Cost of Capital.
- Editable Inputs: Modify key drivers like growth rates, EBITDA %, and CAPEX assumptions.
- Quarterly and Annual Statements: A complete breakdown of CASI's financials.
- Interactive Dashboard: Visualize valuation results and projections dynamically.
Disclaimer
All information, articles, and product details provided on this website are for general informational and educational purposes only. We do not claim any ownership over, nor do we intend to infringe upon, any trademarks, copyrights, logos, brand names, or other intellectual property mentioned or depicted on this site. Such intellectual property remains the property of its respective owners, and any references here are made solely for identification or informational purposes, without implying any affiliation, endorsement, or partnership.
We make no representations or warranties, express or implied, regarding the accuracy, completeness, or suitability of any content or products presented. Nothing on this website should be construed as legal, tax, investment, financial, medical, or other professional advice. In addition, no part of this site—including articles or product references—constitutes a solicitation, recommendation, endorsement, advertisement, or offer to buy or sell any securities, franchises, or other financial instruments, particularly in jurisdictions where such activity would be unlawful.
All content is of a general nature and may not address the specific circumstances of any individual or entity. It is not a substitute for professional advice or services. Any actions you take based on the information provided here are strictly at your own risk. You accept full responsibility for any decisions or outcomes arising from your use of this website and agree to release us from any liability in connection with your use of, or reliance upon, the content or products found herein.