
|
Indian Bank (IndianB.NS) DCF -Bewertung |
Fully Editable: Tailor To Your Needs In Excel Or Sheets
Professional Design: Trusted, Industry-Standard Templates
Investor-Approved Valuation Models
MAC/PC Compatible, Fully Unlocked
No Expertise Is Needed; Easy To Follow
Indian Bank (INDIANB.NS) Bundle
Verbessern Sie Ihre Anlagestrategie mit dem DCF -Taschenrechner der Indian Bank (IndianBNS)! Verwenden Sie genaue Finanzdaten, passen Sie Wachstumsprojektionen und -kosten an und beachten Sie sofort, wie sich diese Veränderungen auf den inneren Wert der indischen Bank (IndianBNS) auswirken.
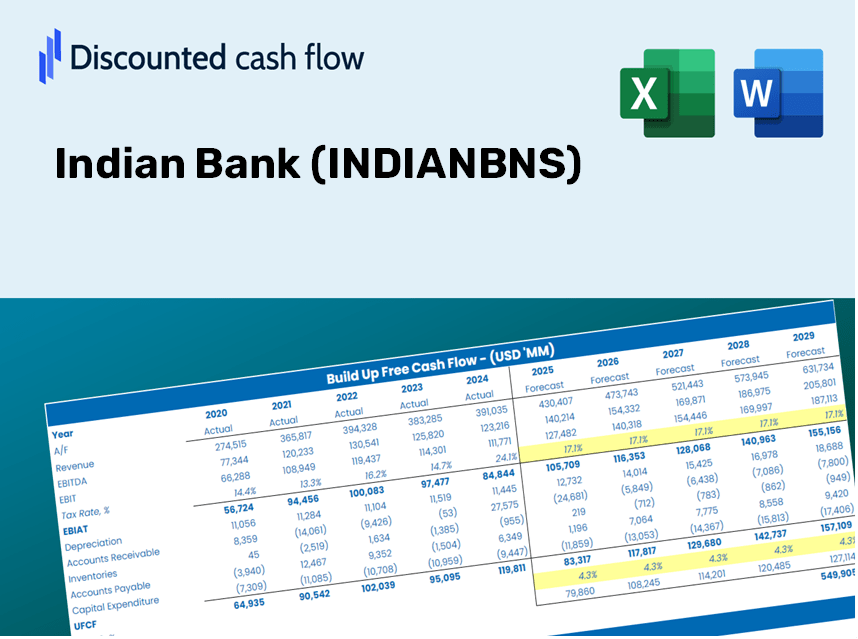
Discounted Cash Flow (DCF) - (USD MM)
| Year | AY1 2021 |
AY2 2022 |
AY3 2023 |
AY4 2024 |
AY5 2025 |
FY1 2026 |
FY2 2027 |
FY3 2028 |
FY4 2029 |
FY5 2030 |
|---|---|---|---|---|---|---|---|---|---|---|
| Revenue | 137,059.0 | 146,068.4 | 527,894.9 | 259,701.5 | 720,491.8 | 1,001,067.6 | 1,390,906.0 | 1,932,556.3 | 2,685,137.5 | 3,730,790.8 |
| Revenue Growth, % | 0 | 6.57 | 261.4 | -50.8 | 177.43 | 38.94 | 38.94 | 38.94 | 38.94 | 38.94 |
| EBITDA | 35,535.2 | 38,541.6 | 64,955.8 | .0 | 115,378.1 | 161,435.0 | 224,301.4 | 311,649.5 | 433,012.9 | 601,637.9 |
| EBITDA, % | 25.93 | 26.39 | 12.3 | 0 | 16.01 | 16.13 | 16.13 | 16.13 | 16.13 | 16.13 |
| Depreciation | 6,369.0 | 6,008.6 | 5,323.9 | 5,311.4 | 5,429.4 | 25,162.3 | 34,961.1 | 48,575.7 | 67,492.2 | 93,775.2 |
| Depreciation, % | 4.65 | 4.11 | 1.01 | 2.05 | 0.75357 | 2.51 | 2.51 | 2.51 | 2.51 | 2.51 |
| EBIT | 29,166.2 | 32,533.0 | 59,631.9 | -5,311.4 | 109,948.7 | 136,272.7 | 189,340.4 | 263,073.8 | 365,520.7 | 507,862.7 |
| EBIT, % | 21.28 | 22.27 | 11.3 | -2.05 | 15.26 | 13.61 | 13.61 | 13.61 | 13.61 | 13.61 |
| Total Cash | 540,995.6 | 799,682.2 | 502,168.3 | 421,769.1 | 549,614.0 | 943,826.1 | 1,311,373.3 | 1,822,051.7 | 2,531,599.9 | 3,517,462.3 |
| Total Cash, percent | .0 | .0 | .0 | .0 | .0 | .0 | .0 | .0 | .0 | .0 |
| Account Receivables | 49,333.3 | 64,297.5 | 58,786.5 | 101,722.9 | 90,050.3 | 285,938.2 | 397,288.9 | 552,002.2 | 766,964.4 | 1,065,637.7 |
| Account Receivables, % | 35.99 | 44.02 | 11.14 | 39.17 | 12.5 | 28.56 | 28.56 | 28.56 | 28.56 | 28.56 |
| Inventories | .0 | -958,384.7 | -648,198.6 | -523,492.0 | .0 | -600,640.6 | -834,543.6 | -1,159,533.8 | -1,611,082.5 | -2,238,474.5 |
| Inventories, % | 0 | -656.12 | -122.79 | -201.57 | 0 | -60 | -60 | -60 | -60 | -60 |
| Accounts Payable | 10,419.3 | 9,942.2 | 14,797.1 | 18,459.9 | 17,766.3 | 53,628.4 | 74,512.5 | 103,529.4 | 143,846.1 | 199,863.0 |
| Accounts Payable, % | 7.6 | 6.81 | 2.8 | 7.11 | 2.47 | 5.36 | 5.36 | 5.36 | 5.36 | 5.36 |
| Capital Expenditure | -5,604.4 | -3,230.9 | -3,343.6 | -6,265.8 | -5,399.4 | -20,214.4 | -28,086.4 | -39,023.8 | -54,220.6 | -75,335.4 |
| Capital Expenditure, % | -4.09 | -2.21 | -0.63338 | -2.41 | -0.7494 | -2.02 | -2.02 | -2.02 | -2.02 | -2.02 |
| Tax Rate, % | 25.7 | 25.7 | 25.7 | 25.7 | 25.7 | 25.7 | 25.7 | 25.7 | 25.7 | 25.7 |
| EBITAT | 30,099.7 | 39,589.1 | 53,540.9 | -3,953.7 | 81,691.1 | 119,517.3 | 166,060.0 | 230,727.5 | 320,578.1 | 445,418.4 |
| Depreciation | ||||||||||
| Changes in Account Receivables | ||||||||||
| Changes in Inventories | ||||||||||
| Changes in Accounts Payable | ||||||||||
| Capital Expenditure | ||||||||||
| UFCF | -8,049.7 | 985,310.2 | -244,299.0 | -168,888.3 | -430,791.9 | 565,080.0 | 316,371.1 | 439,573.1 | 610,752.9 | 848,593.9 |
| WACC, % | 29.8 | 29.8 | 27.18 | 23.24 | 23.21 | 26.64 | 26.64 | 26.64 | 26.64 | 26.64 |
| PV UFCF | ||||||||||
| SUM PV UFCF | 1,357,777.9 | |||||||||
| Long Term Growth Rate, % | 2.00 | |||||||||
| Free cash flow (T + 1) | 865,566 | |||||||||
| Terminal Value | 3,512,330 | |||||||||
| Present Terminal Value | 1,078,148 | |||||||||
| Enterprise Value | 2,435,926 | |||||||||
| Net Debt | 172,259 | |||||||||
| Equity Value | 2,263,667 | |||||||||
| Diluted Shares Outstanding, MM | 1,347 | |||||||||
| Equity Value Per Share | 1,680.64 |
Benefits You Will Receive
- Adjustable Forecast Variables: Effortlessly modify key assumptions (growth %, margins, WACC) to develop various scenarios.
- Relevant Financial Data: Indian Bank’s financial information pre-loaded to facilitate your analysis.
- Instant DCF Calculations: The template automatically computes Net Present Value (NPV) and intrinsic value for you.
- Customizable and Professional Design: A sleek Excel model tailored to meet your valuation requirements.
- Designed for Analysts and Investors: Perfect for examining projections, confirming strategies, and enhancing efficiency.
Key Features
- Real-Life INDIANBNS Data: Pre-populated with Indian Bank's historical financial performance and future projections.
- Fully Customizable Inputs: Modify revenue growth, profit margins, WACC, tax rates, and capital expenditures to suit your analysis.
- Dynamic Valuation Model: Automatically calculates Net Present Value (NPV) and intrinsic value based on your customized inputs.
- Scenario Testing: Develop multiple forecasting scenarios to explore various valuation possibilities.
- User-Friendly Design: Intuitive and organized layout catering to both professionals and newcomers.
How It Functions
- Step 1: Download the Excel file.
- Step 2: Examine the pre-filled data for Indian Bank (INDIANBNS) including historical and projected figures.
- Step 3: Modify the key assumptions (highlighted in yellow) according to your analysis.
- Step 4: Observe the automatic recalculations reflecting Indian Bank's (INDIANBNS) intrinsic value.
- Step 5: Utilize the results for investment strategies or reporting purposes.
Why Choose This Calculator for Indian Bank (INDIANBNS)?
- Tailored for Experts: A sophisticated tool designed for analysts, financial officers, and consultants in banking.
- Comprehensive Data: Access Indian Bank's historical and projected financials preloaded for precise evaluations.
- Scenario Analysis: Effortlessly simulate various forecasts and assumptions to assess potential outcomes.
- Clear Results: Instantly computes intrinsic value, NPV, and crucial financial metrics.
- User-Friendly: Step-by-step guidance makes the process simple and intuitive.
Who Can Benefit from Indian Bank (INDIANBNS)?
- Investors: Gain confidence in your investment choices with a reliable financial resource.
- Financial Analysts: Increase efficiency with tailored financial models and analyses at your fingertips.
- Consultants: Seamlessly modify templates for impactful client presentations or detailed reports.
- Finance Enthusiasts: Enhance your knowledge of banking practices and valuation methodologies through practical examples.
- Educators and Students: Utilize it as an engaging learning resource in finance and banking courses.
Contents of the Template
- Preloaded INDIANBNS Data: Historical and projected financial metrics, such as revenue, EBIT, and capital expenditures.
- DCF and WACC Models: Advanced sheets designed for calculating intrinsic value and the Weighted Average Cost of Capital.
- Editable Inputs: Cells highlighted in yellow for modifying revenue growth, tax rates, and discount rates.
- Financial Statements: Detailed annual and quarterly financials for in-depth analysis.
- Key Ratios: Metrics for profitability, leverage, and efficiency to assess performance.
- Dashboard and Charts: Visual representations of valuation results and underlying assumptions.
Disclaimer
All information, articles, and product details provided on this website are for general informational and educational purposes only. We do not claim any ownership over, nor do we intend to infringe upon, any trademarks, copyrights, logos, brand names, or other intellectual property mentioned or depicted on this site. Such intellectual property remains the property of its respective owners, and any references here are made solely for identification or informational purposes, without implying any affiliation, endorsement, or partnership.
We make no representations or warranties, express or implied, regarding the accuracy, completeness, or suitability of any content or products presented. Nothing on this website should be construed as legal, tax, investment, financial, medical, or other professional advice. In addition, no part of this site—including articles or product references—constitutes a solicitation, recommendation, endorsement, advertisement, or offer to buy or sell any securities, franchises, or other financial instruments, particularly in jurisdictions where such activity would be unlawful.
All content is of a general nature and may not address the specific circumstances of any individual or entity. It is not a substitute for professional advice or services. Any actions you take based on the information provided here are strictly at your own risk. You accept full responsibility for any decisions or outcomes arising from your use of this website and agree to release us from any liability in connection with your use of, or reliance upon, the content or products found herein.