
|
Nomad Foods Limited (NOMD) DCF -Bewertung |
Fully Editable: Tailor To Your Needs In Excel Or Sheets
Professional Design: Trusted, Industry-Standard Templates
Investor-Approved Valuation Models
MAC/PC Compatible, Fully Unlocked
No Expertise Is Needed; Easy To Follow
Nomad Foods Limited (NOMD) Bundle
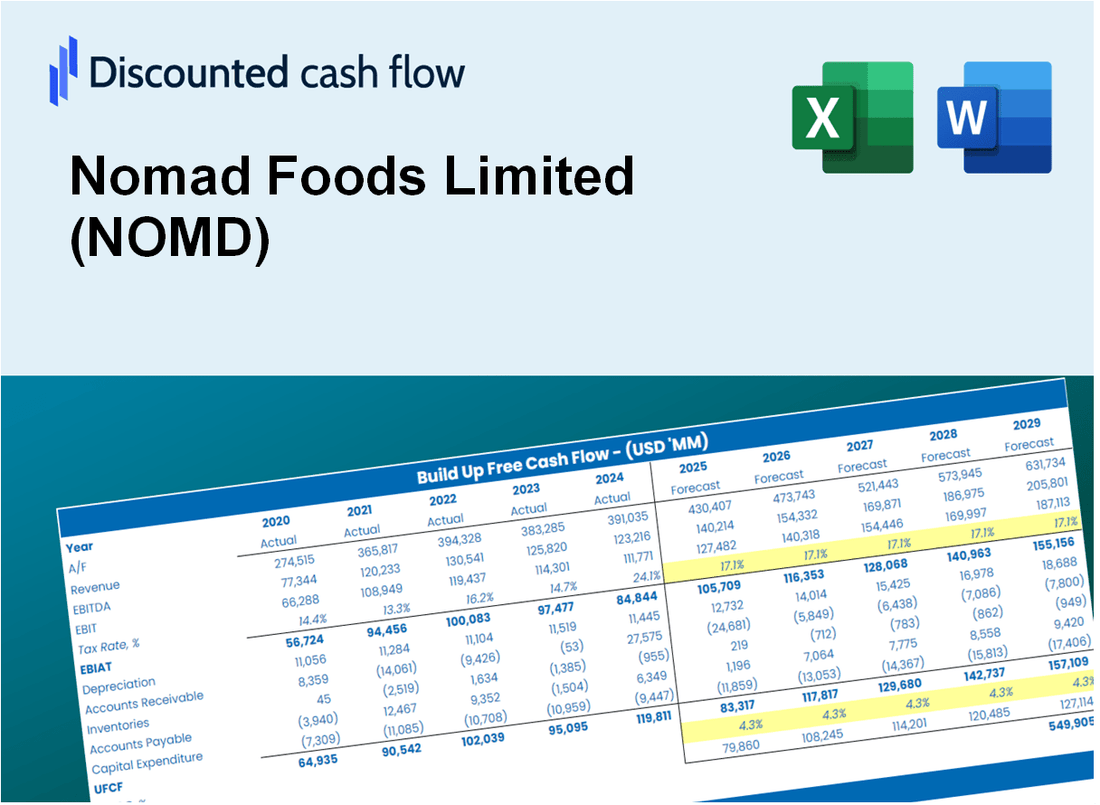
Unabhängig davon, ob Sie ein Investor oder ein Analyst sind, ist dieser (NOMD) DCF-Taschenrechner Ihr Anlaufwerk für eine genaue Bewertung. Mit echten Daten von Nomad Foods Limited geladen, können Sie Prognosen anpassen und die Auswirkungen sofort beobachten.
What You Will Receive
- Adjustable Forecast Inputs: Effortlessly modify assumptions (growth %, margins, WACC) to explore various scenarios.
- Real-World Data: Nomad Foods Limited’s (NOMD) financial data pre-loaded to facilitate your analysis.
- Automated DCF Outputs: The template computes Net Present Value (NPV) and intrinsic value automatically.
- Customizable and Professional: A sleek Excel model that tailors to your valuation requirements.
- Designed for Analysts and Investors: Perfect for evaluating projections, confirming strategies, and optimizing efficiency.
Key Features
- Real-Life NOMD Data: Pre-filled with Nomad Foods Limited's historical financials and future projections.
- Fully Customizable Inputs: Modify revenue growth rates, profit margins, WACC, tax rates, and capital expenditures.
- Dynamic Valuation Model: Automatic recalculations of Net Present Value (NPV) and intrinsic value based on your adjustments.
- Scenario Testing: Develop various forecasting scenarios to evaluate different valuation possibilities.
- User-Friendly Design: Intuitive layout, crafted for both professionals and newcomers.
How It Functions
- Download the Template: Gain immediate access to the Excel-based NOMD DCF Calculator.
- Input Your Assumptions: Modify the yellow-highlighted cells for growth rates, WACC, margins, and other variables.
- Instant Calculations: The model automatically recalculates Nomad Foods' intrinsic value.
- Test Scenarios: Experiment with various assumptions to assess potential changes in valuation.
- Analyze and Decide: Utilize the results to inform your investment or financial decisions.
Why Choose This Calculator for Nomad Foods Limited (NOMD)?
- Accuracy: Utilizes real Nomad Foods financial data to ensure precision.
- Flexibility: Allows users to easily test and adjust inputs as needed.
- Time-Saving: Avoid the complexities of constructing a DCF model from the ground up.
- Professional-Grade: Crafted with the expertise and usability expected at the CFO level.
- User-Friendly: Designed for simplicity, making it accessible for users without extensive financial modeling skills.
Who Should Use This Product?
- Investors: Assess Nomad Foods Limited's (NOMD) valuation prior to making investment decisions.
- CFOs and Financial Analysts: Optimize valuation methodologies and evaluate financial forecasts.
- Startup Founders: Understand the valuation approaches of established companies like Nomad Foods Limited.
- Consultants: Provide comprehensive valuation analyses and reports for clients.
- Students and Educators: Utilize real-time data to enhance learning and instruction in valuation practices.
What the Template Contains
- Pre-Filled Data: Includes Nomad Foods Limited’s historical financials and forecasts.
- Discounted Cash Flow Model: Editable DCF valuation model with automatic calculations.
- Weighted Average Cost of Capital (WACC): A dedicated sheet for calculating WACC based on custom inputs.
- Key Financial Ratios: Analyze Nomad Foods Limited’s profitability, efficiency, and leverage.
- Customizable Inputs: Edit revenue growth, margins, and tax rates with ease.
- Clear Dashboard: Charts and tables summarizing key valuation results.
Disclaimer
All information, articles, and product details provided on this website are for general informational and educational purposes only. We do not claim any ownership over, nor do we intend to infringe upon, any trademarks, copyrights, logos, brand names, or other intellectual property mentioned or depicted on this site. Such intellectual property remains the property of its respective owners, and any references here are made solely for identification or informational purposes, without implying any affiliation, endorsement, or partnership.
We make no representations or warranties, express or implied, regarding the accuracy, completeness, or suitability of any content or products presented. Nothing on this website should be construed as legal, tax, investment, financial, medical, or other professional advice. In addition, no part of this site—including articles or product references—constitutes a solicitation, recommendation, endorsement, advertisement, or offer to buy or sell any securities, franchises, or other financial instruments, particularly in jurisdictions where such activity would be unlawful.
All content is of a general nature and may not address the specific circumstances of any individual or entity. It is not a substitute for professional advice or services. Any actions you take based on the information provided here are strictly at your own risk. You accept full responsibility for any decisions or outcomes arising from your use of this website and agree to release us from any liability in connection with your use of, or reliance upon, the content or products found herein.