
|
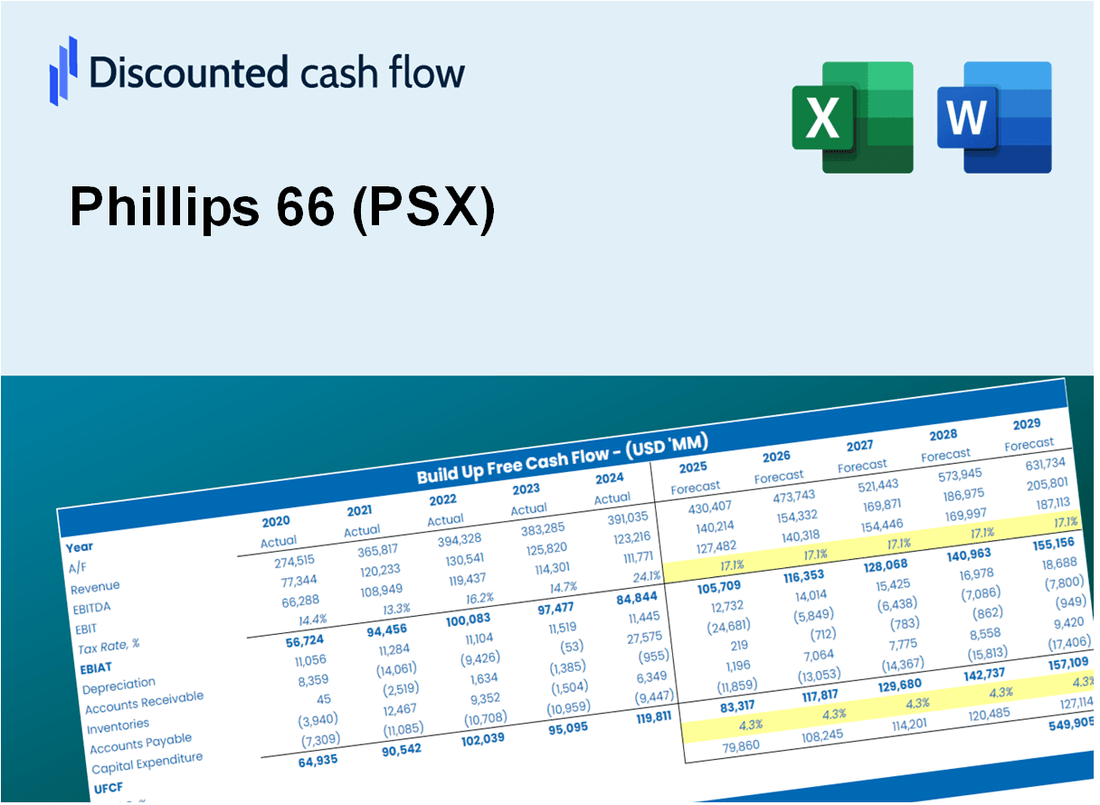
Phillips 66 (PSX) DCF -Bewertung |
Fully Editable: Tailor To Your Needs In Excel Or Sheets
Professional Design: Trusted, Industry-Standard Templates
Investor-Approved Valuation Models
MAC/PC Compatible, Fully Unlocked
No Expertise Is Needed; Easy To Follow
Phillips 66 (PSX) Bundle
Möchten Sie den inneren Wert von Phillips 66 bewerten? Unser PSX DCF-Taschenrechner integriert reale Daten mit umfangreichen Anpassungsfunktionen, sodass Sie Ihre Prognosen verfeinern und Ihre Anlagestrategie verbessern können.
What You Will Get
- Real PSX Financial Data: Pre-filled with Phillips 66’s historical and projected data for precise analysis.
- Fully Editable Template: Modify key inputs like revenue growth, WACC, and EBITDA % with ease.
- Automatic Calculations: See Phillips 66’s intrinsic value update instantly based on your changes.
- Professional Valuation Tool: Designed for investors, analysts, and consultants seeking accurate DCF results.
- User-Friendly Design: Simple structure and clear instructions for all experience levels.
Key Features
- Customizable Financial Assumptions: Adjust essential metrics such as revenue projections, operating margins, and capital investments.
- Instant DCF Valuation: Quickly computes intrinsic value, net present value (NPV), and various financial outputs.
- High-Precision Accuracy: Leverages Phillips 66's (PSX) actual financial data for dependable valuation results.
- Effortless Scenario Analysis: Easily evaluate different scenarios and assess their impacts on financial outcomes.
- Efficiency Boost: Avoid the hassle of constructing intricate valuation models from the ground up.
How It Works
- Download: Obtain the pre-prepared Excel file containing Phillips 66's (PSX) financial data.
- Customize: Modify projections, such as revenue growth, EBITDA %, and WACC.
- Update Automatically: The intrinsic value and NPV calculations refresh in real-time.
- Test Scenarios: Generate various forecasts and instantly compare results.
- Make Decisions: Leverage the valuation insights to inform your investment approach.
Why Choose Phillips 66 (PSX)?
- Save Time: Access ready-to-use resources without the hassle of starting from scratch.
- Enhance Accuracy: Utilize dependable data and calculations to minimize valuation errors.
- Completely Customizable: Adjust models to align with your specific assumptions and forecasts.
- User-Friendly: Intuitive charts and outputs simplify the analysis of results.
- Endorsed by Professionals: Crafted for experts who prioritize accuracy and functionality.
Who Should Use This Product?
- Finance Students: Master valuation techniques and apply them using real data from Phillips 66 (PSX).
- Academics: Integrate industry-specific models into your coursework or research focused on Phillips 66 (PSX).
- Investors: Evaluate your own assumptions and analyze valuation outcomes for Phillips 66 (PSX) stock.
- Analysts: Enhance your efficiency with a ready-to-use, customizable DCF model tailored for Phillips 66 (PSX).
- Small Business Owners: Understand how major public companies like Phillips 66 (PSX) are analyzed in the market.
What the Template Contains
- Pre-Filled Data: Includes Phillips 66’s historical financials and forecasts.
- Discounted Cash Flow Model: Editable DCF valuation model with automatic calculations.
- Weighted Average Cost of Capital (WACC): A dedicated sheet for calculating WACC based on custom inputs.
- Key Financial Ratios: Analyze Phillips 66’s profitability, efficiency, and leverage.
- Customizable Inputs: Edit revenue growth, margins, and tax rates with ease.
- Clear Dashboard: Charts and tables summarizing key valuation results.
Disclaimer
All information, articles, and product details provided on this website are for general informational and educational purposes only. We do not claim any ownership over, nor do we intend to infringe upon, any trademarks, copyrights, logos, brand names, or other intellectual property mentioned or depicted on this site. Such intellectual property remains the property of its respective owners, and any references here are made solely for identification or informational purposes, without implying any affiliation, endorsement, or partnership.
We make no representations or warranties, express or implied, regarding the accuracy, completeness, or suitability of any content or products presented. Nothing on this website should be construed as legal, tax, investment, financial, medical, or other professional advice. In addition, no part of this site—including articles or product references—constitutes a solicitation, recommendation, endorsement, advertisement, or offer to buy or sell any securities, franchises, or other financial instruments, particularly in jurisdictions where such activity would be unlawful.
All content is of a general nature and may not address the specific circumstances of any individual or entity. It is not a substitute for professional advice or services. Any actions you take based on the information provided here are strictly at your own risk. You accept full responsibility for any decisions or outcomes arising from your use of this website and agree to release us from any liability in connection with your use of, or reliance upon, the content or products found herein.