
|
SJW Group (SJW) DCF -Bewertung |
Fully Editable: Tailor To Your Needs In Excel Or Sheets
Professional Design: Trusted, Industry-Standard Templates
Investor-Approved Valuation Models
MAC/PC Compatible, Fully Unlocked
No Expertise Is Needed; Easy To Follow
SJW Group (SJW) Bundle
Vereinfachen Sie die Bewertung der SJW Group (SJW) mit diesem anpassbaren DCF -Taschenrechner! Mit Real SJW Group (SJW) Finanzdaten und einstellbaren Prognoseeingaben können Sie Szenarien testen und die SJW Group (SJW) in Minuten aufdecken.
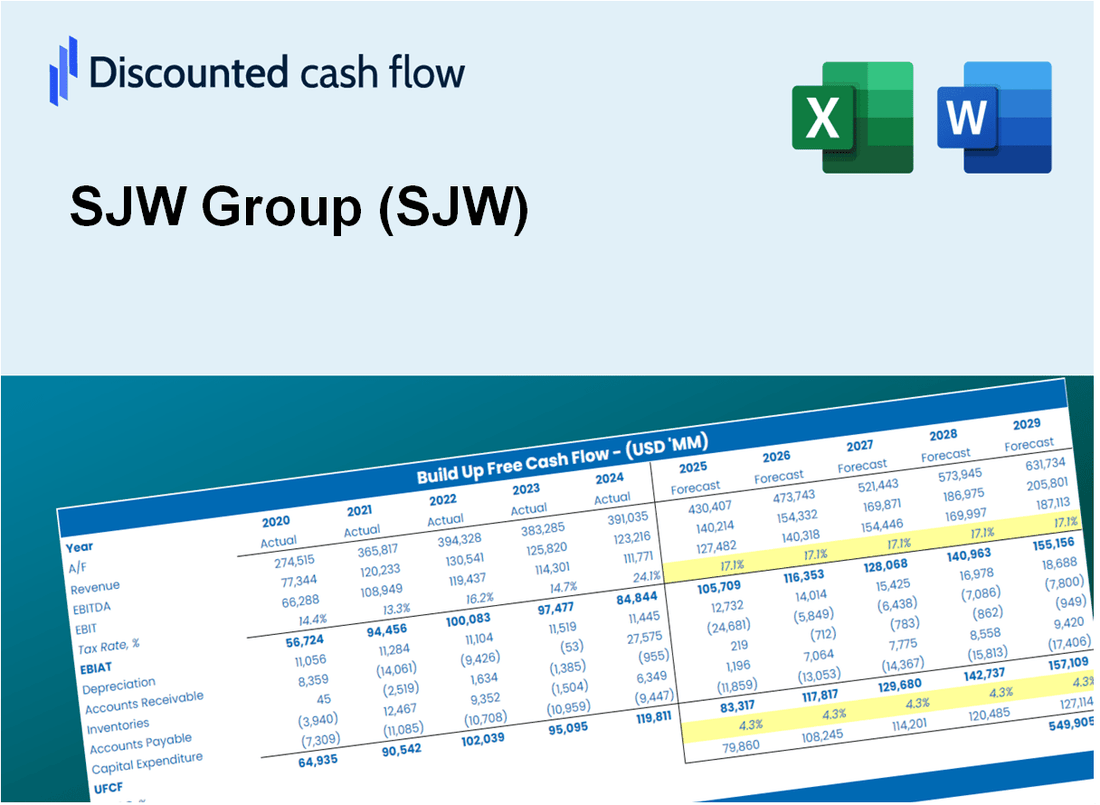
Discounted Cash Flow (DCF) - (USD MM)
| Year | AY1 2020 |
AY2 2021 |
AY3 2022 |
AY4 2023 |
AY5 2024 |
FY1 2025 |
FY2 2026 |
FY3 2027 |
FY4 2028 |
FY5 2029 |
|---|---|---|---|---|---|---|---|---|---|---|
| Revenue | 564.5 | 573.7 | 620.7 | 670.4 | 748.4 | 803.6 | 862.8 | 926.3 | 994.6 | 1,067.8 |
| Revenue Growth, % | 0 | 1.62 | 8.19 | 8 | 11.65 | 7.37 | 7.37 | 7.37 | 7.37 | 7.37 |
| EBITDA | 208.9 | 309.5 | 236.2 | 265.2 | 289.4 | 333.1 | 357.6 | 384.0 | 412.2 | 442.6 |
| EBITDA, % | 37.01 | 53.95 | 38.06 | 39.56 | 38.66 | 41.45 | 41.45 | 41.45 | 41.45 | 41.45 |
| Depreciation | 91.6 | 186.3 | 106.4 | 108.1 | 115.1 | 156.5 | 168.0 | 180.4 | 193.7 | 207.9 |
| Depreciation, % | 16.23 | 32.48 | 17.15 | 16.13 | 15.37 | 19.47 | 19.47 | 19.47 | 19.47 | 19.47 |
| EBIT | 117.3 | 123.2 | 129.8 | 157.1 | 174.3 | 176.6 | 189.6 | 203.6 | 218.6 | 234.7 |
| EBIT, % | 20.78 | 21.47 | 20.91 | 23.43 | 23.29 | 21.98 | 21.98 | 21.98 | 21.98 | 21.98 |
| Total Cash | 5.3 | 10.9 | 12.3 | 9.7 | 1.3 | 10.4 | 11.1 | 11.9 | 12.8 | 13.8 |
| Total Cash, percent | .0 | .0 | .0 | .0 | .0 | .0 | .0 | .0 | .0 | .0 |
| Account Receivables | 103.1 | 104.8 | 110.5 | 126.3 | .0 | 117.6 | 126.2 | 135.5 | 145.5 | 156.2 |
| Account Receivables, % | 18.26 | 18.26 | 17.8 | 18.84 | 0 | 14.63 | 14.63 | 14.63 | 14.63 | 14.63 |
| Inventories | 12.1 | 10.9 | 9.8 | .0 | .0 | 9.0 | 9.7 | 10.4 | 11.2 | 12.0 |
| Inventories, % | 2.14 | 1.9 | 1.57 | 0 | 0 | 1.12 | 1.12 | 1.12 | 1.12 | 1.12 |
| Accounts Payable | 34.2 | 30.4 | 29.6 | 46.1 | 1.6 | 37.3 | 40.1 | 43.0 | 46.2 | 49.6 |
| Accounts Payable, % | 6.06 | 5.3 | 4.77 | 6.88 | 0.21217 | 4.64 | 4.64 | 4.64 | 4.64 | 4.64 |
| Capital Expenditure | -215.0 | -253.8 | -244.2 | -290.7 | .0 | -265.2 | -284.8 | -305.8 | -328.3 | -352.5 |
| Capital Expenditure, % | -38.08 | -44.24 | -39.35 | -43.37 | 0 | -33.01 | -33.01 | -33.01 | -33.01 | -33.01 |
| Tax Rate, % | 8.71 | 8.71 | 8.71 | 8.71 | 8.71 | 8.71 | 8.71 | 8.71 | 8.71 | 8.71 |
| EBITAT | 103.2 | 108.2 | 116.4 | 146.8 | 159.1 | 159.0 | 170.8 | 183.3 | 196.8 | 211.3 |
| Depreciation | ||||||||||
| Changes in Account Receivables | ||||||||||
| Changes in Inventories | ||||||||||
| Changes in Accounts Payable | ||||||||||
| Capital Expenditure | ||||||||||
| UFCF | -101.1 | 36.4 | -26.8 | -25.3 | 355.9 | -40.6 | 47.4 | 50.9 | 54.6 | 58.7 |
| WACC, % | 10.03 | 10.02 | 10.1 | 10.25 | 10.16 | 10.11 | 10.11 | 10.11 | 10.11 | 10.11 |
| PV UFCF | ||||||||||
| SUM PV UFCF | 113.7 | |||||||||
| Long Term Growth Rate, % | 4.00 | |||||||||
| Free cash flow (T + 1) | 61 | |||||||||
| Terminal Value | 998 | |||||||||
| Present Terminal Value | 617 | |||||||||
| Enterprise Value | 730 | |||||||||
| Net Debt | 2 | |||||||||
| Equity Value | 729 | |||||||||
| Diluted Shares Outstanding, MM | 33 | |||||||||
| Equity Value Per Share | 22.23 |
What You Will Get
- Editable Forecast Inputs: Effortlessly adjust key assumptions (growth %, margins, WACC) to explore various scenarios.
- Real-World Data: SJW Group’s financial data pre-loaded to facilitate your analysis.
- Automatic DCF Outputs: The template computes Net Present Value (NPV) and intrinsic value automatically.
- Customizable and Professional: A refined Excel model that caters to your valuation requirements.
- Built for Analysts and Investors: Perfect for evaluating projections, validating strategies, and enhancing efficiency.
Key Features
- Customizable Financial Inputs: Adjust essential parameters such as revenue projections, operating margins, and capital investments.
- Instant DCF Valuation: Quickly computes intrinsic value, net present value (NPV), and additional financial metrics.
- High-Precision Outputs: Incorporates SJW Group's actual financial data for accurate valuation results.
- Streamlined Scenario Testing: Easily evaluate various assumptions and analyze different outcomes.
- Efficiency Booster: Avoid the complexities of constructing detailed valuation models from the ground up.
How It Works
- Step 1: Download the Excel file for SJW Group (SJW).
- Step 2: Review SJW Group's pre-filled financial data and forecasts.
- Step 3: Modify key inputs such as revenue growth, WACC, and tax rates (highlighted cells).
- Step 4: Observe the DCF model update in real-time as you adjust your assumptions.
- Step 5: Analyze the outputs and utilize the results for your investment decisions.
Why Choose This Calculator for SJW Group (SJW)?
- User-Friendly Interface: Tailored for both novice users and seasoned professionals.
- Customizable Inputs: Easily adjust parameters to suit your financial analysis.
- Real-Time Valuation: Instantly observe changes in SJW Group’s valuation as you tweak inputs.
- Preloaded Data: Comes with SJW Group’s latest financial statistics for immediate evaluation.
- Preferred by Experts: Widely utilized by investors and analysts for sound decision-making.
Who Should Use SJW Group (SJW)?
- Professional Investors: Develop comprehensive and trustworthy valuation models for investment assessments.
- Corporate Finance Teams: Evaluate valuation scenarios to inform strategic decision-making.
- Consultants and Advisors: Deliver precise valuation insights for SJW Group (SJW) to clients.
- Students and Educators: Utilize real-world data to enhance financial modeling skills and education.
- Utility Sector Enthusiasts: Gain insights into how utility companies like SJW Group (SJW) are valued in the marketplace.
What the Template Contains
- Operating and Balance Sheet Data: Pre-filled SJW Group historical data and forecasts, including revenue, EBITDA, EBIT, and capital expenditures.
- WACC Calculation: A dedicated sheet for Weighted Average Cost of Capital (WACC), including parameters like Beta, risk-free rate, and share price.
- DCF Valuation (Unlevered and Levered): Editable Discounted Cash Flow models showing intrinsic value with detailed calculations.
- Financial Statements: Pre-loaded financial statements (annual and quarterly) to support analysis.
- Key Ratios: Includes profitability, leverage, and efficiency ratios for SJW Group.
- Dashboard and Charts: Visual summary of valuation outputs and assumptions to analyze results easily.
Disclaimer
All information, articles, and product details provided on this website are for general informational and educational purposes only. We do not claim any ownership over, nor do we intend to infringe upon, any trademarks, copyrights, logos, brand names, or other intellectual property mentioned or depicted on this site. Such intellectual property remains the property of its respective owners, and any references here are made solely for identification or informational purposes, without implying any affiliation, endorsement, or partnership.
We make no representations or warranties, express or implied, regarding the accuracy, completeness, or suitability of any content or products presented. Nothing on this website should be construed as legal, tax, investment, financial, medical, or other professional advice. In addition, no part of this site—including articles or product references—constitutes a solicitation, recommendation, endorsement, advertisement, or offer to buy or sell any securities, franchises, or other financial instruments, particularly in jurisdictions where such activity would be unlawful.
All content is of a general nature and may not address the specific circumstances of any individual or entity. It is not a substitute for professional advice or services. Any actions you take based on the information provided here are strictly at your own risk. You accept full responsibility for any decisions or outcomes arising from your use of this website and agree to release us from any liability in connection with your use of, or reliance upon, the content or products found herein.