|
Taiwan Semiconductor Manufacturing Company Limited (TSM) DCF -Bewertung |
Fully Editable: Tailor To Your Needs In Excel Or Sheets
Professional Design: Trusted, Industry-Standard Templates
Investor-Approved Valuation Models
MAC/PC Compatible, Fully Unlocked
No Expertise Is Needed; Easy To Follow
Taiwan Semiconductor Manufacturing Company Limited (TSM) Bundle
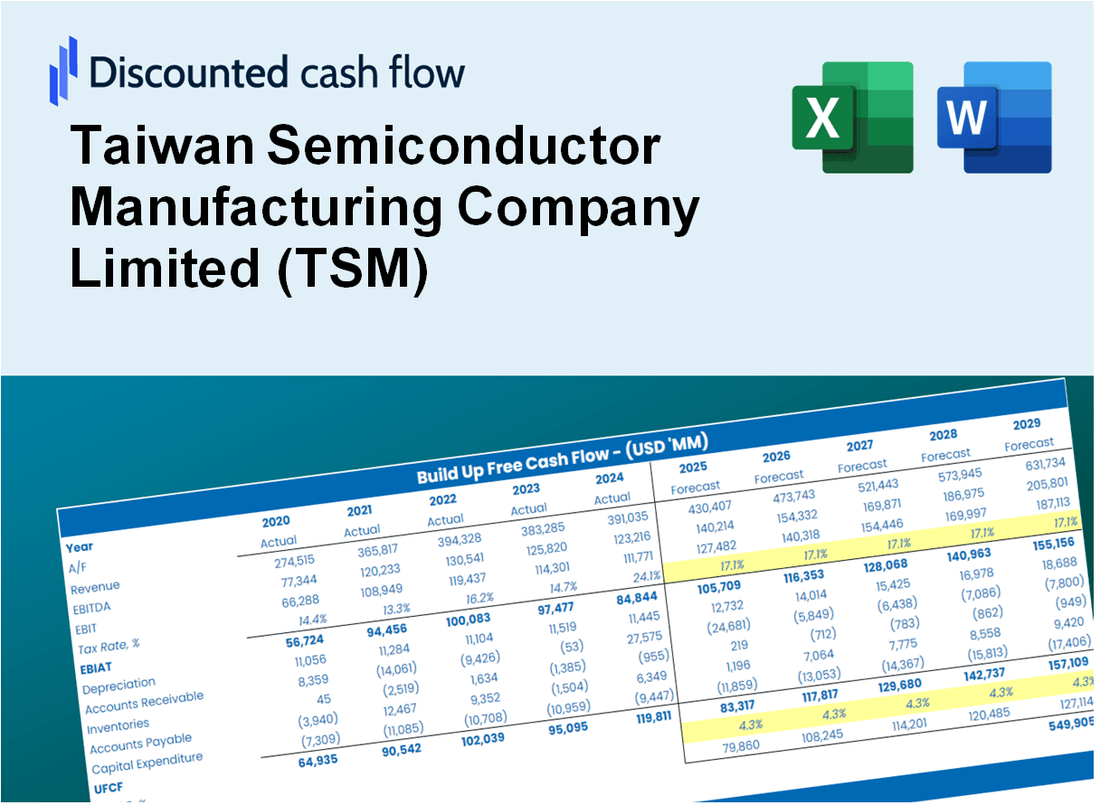
Entdecken Sie die finanziellen Aussichten der Taiwan Semiconductor Manufacturing Company Limited (TSM) mit unserem benutzerfreundlichen DCF-Taschenrechner! Geben Sie Ihre Annahmen in Bezug auf Wachstum, Margen und Kosten ein, um den intrinsischen Wert des Taiwan Semiconductor Manufacturing Company Limited (TSM) zu bestimmen und informieren Sie Ihren Investitionsansatz.
Discounted Cash Flow (DCF) - (USD MM)
| Year | AY1 2020 |
AY2 2021 |
AY3 2022 |
AY4 2023 |
AY5 2024 |
FY1 2025 |
FY2 2026 |
FY3 2027 |
FY4 2028 |
FY5 2029 |
|---|---|---|---|---|---|---|---|---|---|---|
| Revenue | 43,810.8 | 51,928.8 | 74,058.3 | 70,716.5 | 94,681.0 | 116,107.4 | 142,382.6 | 174,604.0 | 214,117.1 | 262,572.0 |
| Revenue Growth, % | 0 | 18.53 | 42.61 | -4.51 | 33.89 | 22.63 | 22.63 | 22.63 | 22.63 | 22.63 |
| EBITDA | 30,048.4 | 35,684.6 | 52,114.0 | 49,838.2 | 64,930.0 | 80,515.3 | 98,736.1 | 121,080.1 | 148,480.7 | 182,082.1 |
| EBITDA, % | 68.59 | 68.72 | 70.37 | 70.48 | 68.58 | 69.35 | 69.35 | 69.35 | 69.35 | 69.35 |
| Depreciation | 10,851.6 | 13,817.7 | 14,303.8 | 17,409.5 | 21,681.9 | 27,450.4 | 33,662.5 | 41,280.3 | 50,622.1 | 62,077.9 |
| Depreciation, % | 24.77 | 26.61 | 19.31 | 24.62 | 22.9 | 23.64 | 23.64 | 23.64 | 23.64 | 23.64 |
| EBIT | 19,196.8 | 21,866.9 | 37,810.2 | 32,428.7 | 43,248.1 | 53,064.9 | 65,073.6 | 79,799.8 | 97,858.6 | 120,004.1 |
| EBIT, % | 43.82 | 42.11 | 51.05 | 45.86 | 45.68 | 45.7 | 45.7 | 45.7 | 45.7 | 45.7 |
| Total Cash | 26,166.8 | 39,416.1 | 51,898.9 | 56,096.1 | 81,296.2 | 86,128.0 | 105,618.8 | 129,520.5 | 158,831.1 | 194,774.8 |
| Total Cash, percent | .0 | .0 | .0 | .0 | .0 | .0 | .0 | .0 | .0 | .0 |
| Account Receivables | 4,779.0 | 6,489.0 | 7,570.0 | 6,608.3 | 8,900.8 | 12,161.4 | 14,913.6 | 18,288.6 | 22,427.3 | 27,502.6 |
| Account Receivables, % | 10.91 | 12.5 | 10.22 | 9.34 | 9.4 | 10.47 | 10.47 | 10.47 | 10.47 | 10.47 |
| Inventories | 4,493.2 | 6,316.9 | 7,234.4 | 8,210.8 | 9,417.0 | 12,480.6 | 15,305.0 | 18,768.5 | 23,015.9 | 28,224.4 |
| Inventories, % | 10.26 | 12.16 | 9.77 | 11.61 | 9.95 | 10.75 | 10.75 | 10.75 | 10.75 | 10.75 |
| Accounts Payable | 6,437.6 | 6,314.5 | 8,779.4 | 7,432.7 | 8,683.2 | 13,559.1 | 16,627.6 | 20,390.4 | 25,004.8 | 30,663.4 |
| Accounts Payable, % | 14.69 | 12.16 | 11.85 | 10.51 | 9.17 | 11.68 | 11.68 | 11.68 | 11.68 | 11.68 |
| Capital Expenditure | -17,058.9 | -27,787.5 | -35,644.8 | -31,253.8 | -31,273.7 | -50,577.7 | -62,023.4 | -76,059.4 | -93,271.7 | -114,379.2 |
| Capital Expenditure, % | -38.94 | -53.51 | -48.13 | -44.2 | -33.03 | -43.56 | -43.56 | -43.56 | -43.56 | -43.56 |
| Tax Rate, % | 17.6 | 17.6 | 17.6 | 17.6 | 17.6 | 17.6 | 17.6 | 17.6 | 17.6 | 17.6 |
| EBITAT | 16,767.4 | 19,536.0 | 32,814.9 | 28,208.4 | 35,635.5 | 45,939.1 | 56,335.1 | 69,083.8 | 84,717.6 | 103,889.3 |
| Depreciation | ||||||||||
| Changes in Account Receivables | ||||||||||
| Changes in Inventories | ||||||||||
| Changes in Accounts Payable | ||||||||||
| Capital Expenditure | ||||||||||
| UFCF | 7,725.5 | 1,909.4 | 11,940.4 | 13,002.7 | 23,795.5 | 21,363.5 | 25,466.1 | 31,229.1 | 38,296.2 | 46,962.7 |
| WACC, % | 9.02 | 9.03 | 9.02 | 9.02 | 9 | 9.02 | 9.02 | 9.02 | 9.02 | 9.02 |
| PV UFCF | ||||||||||
| SUM PV UFCF | 122,739.0 | |||||||||
| Long Term Growth Rate, % | 2.00 | |||||||||
| Free cash flow (T + 1) | 47,902 | |||||||||
| Terminal Value | 682,650 | |||||||||
| Present Terminal Value | 443,329 | |||||||||
| Enterprise Value | 566,068 | |||||||||
| Net Debt | -35,349 | |||||||||
| Equity Value | 601,417 | |||||||||
| Diluted Shares Outstanding, MM | 1,037 | |||||||||
| Equity Value Per Share | 579.90 |
What You Will Get
- Pre-Filled Financial Model: TSM's actual data allows for accurate DCF valuation.
- Full Forecast Control: Modify revenue growth, profit margins, WACC, and other critical factors.
- Instant Calculations: Real-time updates provide immediate feedback as you make adjustments.
- Investor-Ready Template: A polished Excel file crafted for high-quality valuation presentations.
- Customizable and Reusable: Designed for adaptability, enabling repeated use for in-depth forecasts.
Key Features
- 🔍 Real-Life TSM Financials: Pre-filled historical and projected data for Taiwan Semiconductor Manufacturing Company Limited (TSM).
- ✏️ Fully Customizable Inputs: Adjust all critical parameters (yellow cells) like WACC, growth %, and tax rates.
- 📊 Professional DCF Valuation: Built-in formulas calculate TSM’s intrinsic value using the Discounted Cash Flow method.
- ⚡ Instant Results: Visualize TSM’s valuation instantly after making changes.
- Scenario Analysis: Test and compare outcomes for various financial assumptions side-by-side.
How It Works
- 1. Access the Template: Download and open the Excel file containing TSM's (TSM) preloaded financial data.
- 2. Modify Assumptions: Adjust key variables such as growth rates, WACC, and capital expenditures.
- 3. Analyze Results Instantly: The DCF model automatically computes intrinsic value and NPV.
- 4. Explore Scenarios: Evaluate various forecasts to investigate different valuation results.
- 5. Present with Assurance: Deliver professional valuation insights to enhance your decision-making process.
Why Choose This Calculator for TSM?
- Designed for Industry Experts: A sophisticated tool tailored for analysts, CFOs, and investment consultants.
- Accurate Financial Data: TSM's historical and projected financials are preloaded for precision.
- Flexible Scenario Analysis: Effortlessly test various forecasts and assumptions.
- Comprehensive Outputs: Instantly calculates intrinsic value, NPV, and essential financial metrics.
- User-Friendly Interface: Step-by-step guidance simplifies the calculation process.
Who Should Use This Product?
- Engineering Students: Understand semiconductor manufacturing processes and apply theoretical knowledge with real-world examples.
- Researchers: Utilize TSM's data for studies on chip technology and industry trends.
- Investors: Evaluate your investment strategies and analyze financial performance for Taiwan Semiconductor Manufacturing Company Limited (TSM).
- Industry Analysts: Enhance your analysis with a comprehensive overview of TSM's market position and competitive advantages.
- Tech Entrepreneurs: Learn from TSM's business model and operational efficiencies to inform your own ventures.
What the Template Contains
- Historical Data: Includes Taiwan Semiconductor Manufacturing Company's (TSM) past financials and baseline forecasts.
- DCF and Levered DCF Models: Detailed templates to calculate Taiwan Semiconductor Manufacturing Company's (TSM) intrinsic value.
- WACC Sheet: Pre-built calculations for Weighted Average Cost of Capital.
- Editable Inputs: Modify key drivers like growth rates, EBITDA %, and CAPEX assumptions.
- Quarterly and Annual Statements: A complete breakdown of Taiwan Semiconductor Manufacturing Company's (TSM) financials.
- Interactive Dashboard: Visualize valuation results and projections dynamically.
Disclaimer
All information, articles, and product details provided on this website are for general informational and educational purposes only. We do not claim any ownership over, nor do we intend to infringe upon, any trademarks, copyrights, logos, brand names, or other intellectual property mentioned or depicted on this site. Such intellectual property remains the property of its respective owners, and any references here are made solely for identification or informational purposes, without implying any affiliation, endorsement, or partnership.
We make no representations or warranties, express or implied, regarding the accuracy, completeness, or suitability of any content or products presented. Nothing on this website should be construed as legal, tax, investment, financial, medical, or other professional advice. In addition, no part of this site—including articles or product references—constitutes a solicitation, recommendation, endorsement, advertisement, or offer to buy or sell any securities, franchises, or other financial instruments, particularly in jurisdictions where such activity would be unlawful.
All content is of a general nature and may not address the specific circumstances of any individual or entity. It is not a substitute for professional advice or services. Any actions you take based on the information provided here are strictly at your own risk. You accept full responsibility for any decisions or outcomes arising from your use of this website and agree to release us from any liability in connection with your use of, or reliance upon, the content or products found herein.