
|
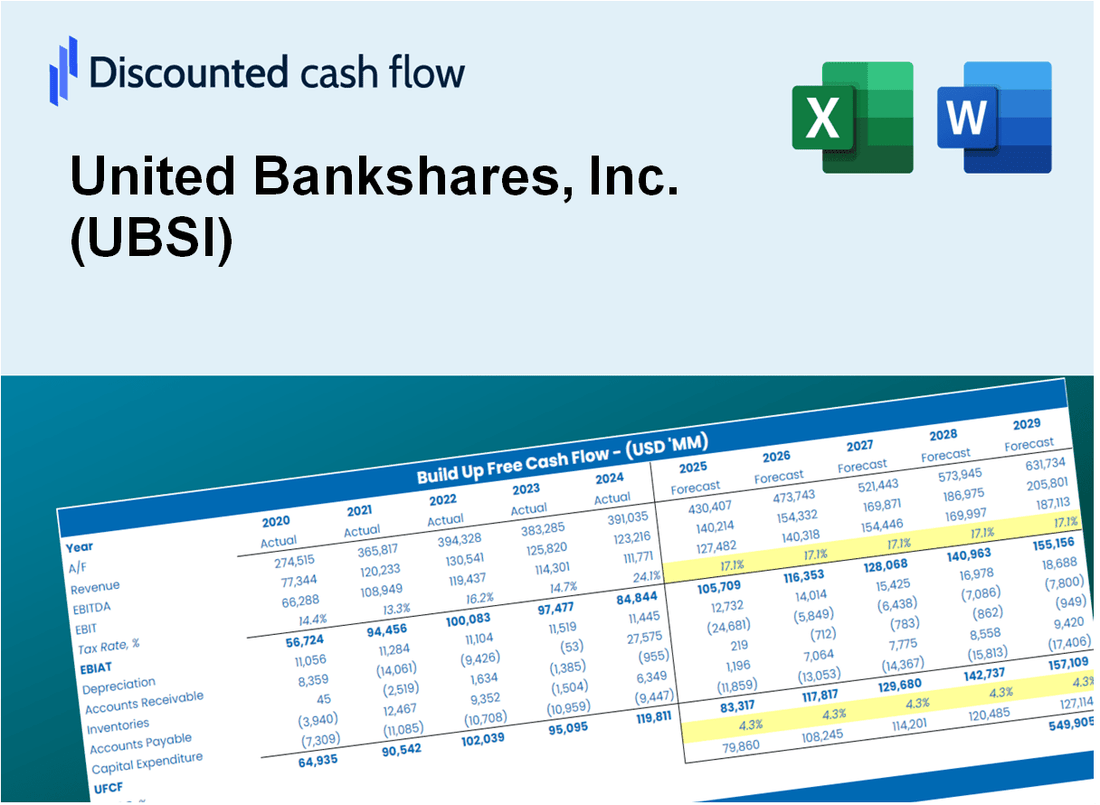
United Bankshares, Inc. (UBSI) DCF -Bewertung |
Fully Editable: Tailor To Your Needs In Excel Or Sheets
Professional Design: Trusted, Industry-Standard Templates
Investor-Approved Valuation Models
MAC/PC Compatible, Fully Unlocked
No Expertise Is Needed; Easy To Follow
United Bankshares, Inc. (UBSI) Bundle
Entdecken Sie das finanzielle Potenzial von United Bankshares, Inc. (UBSI) mit unserem benutzerfreundlichen DCF-Taschenrechner! Geben Sie Ihre Prognosen für Wachstum, Margen und Ausgaben ein, um den inneren Wert von United Bankshares, Inc. (UBSI) zu bestimmen und verbessern Sie Ihren Investitionsansatz.
What You Will Get
- Editable Forecast Inputs: Effortlessly modify assumptions (growth %, margins, WACC) to generate various scenarios.
- Real-World Data: United Bankshares, Inc. (UBSI)’s financial data pre-loaded to facilitate your analysis.
- Automatic DCF Outputs: The template computes Net Present Value (NPV) and intrinsic value automatically.
- Customizable and Professional: A refined Excel model that adjusts to your valuation requirements.
- Built for Analysts and Investors: Perfect for evaluating projections, confirming strategies, and enhancing efficiency.
Key Features
- Accurate United Bankshares Financials: Gain access to reliable pre-loaded historical data and future forecasts.
- Adjustable Forecast Parameters: Modify highlighted cells for metrics such as WACC, growth rates, and profit margins.
- Real-Time Calculations: Instant updates for DCF, Net Present Value (NPV), and cash flow assessments.
- User-Friendly Dashboard: Clear charts and summaries to help you visualize your valuation outcomes.
- Designed for All Skill Levels: A straightforward, intuitive layout tailored for investors, CFOs, and consultants alike.
How It Works
- Step 1: Download the Excel file.
- Step 2: Review pre-entered United Bankshares, Inc. (UBSI) data (historical and projected).
- Step 3: Adjust key assumptions (yellow cells) based on your analysis.
- Step 4: View automatic recalculations for United Bankshares, Inc. (UBSI)'s intrinsic value.
- Step 5: Use the outputs for investment decisions or reporting.
Why Choose This Calculator for United Bankshares, Inc. (UBSI)?
- Accurate Data: Up-to-date financials for United Bankshares, Inc. ensure reliable valuation outcomes.
- Customizable: Modify essential parameters such as growth rates, WACC, and tax rates to align with your forecasts.
- Time-Saving: Pre-configured calculations save you the hassle of starting from scratch.
- Professional-Grade Tool: Tailored for investors, analysts, and financial consultants.
- User-Friendly: An intuitive design and clear instructions make it accessible for all users.
Who Should Use This Product?
- Finance Students: Discover financial modeling techniques and apply them to real-world scenarios involving United Bankshares, Inc. (UBSI).
- Academics: Integrate advanced financial models into your curriculum or research focused on banking sectors.
- Investors: Evaluate your investment strategies and analyze performance metrics for United Bankshares, Inc. (UBSI).
- Analysts: Enhance your analysis process with a customizable financial model tailored for United Bankshares, Inc. (UBSI).
- Small Business Owners: Understand the financial evaluation methods used for large banking institutions like United Bankshares, Inc. (UBSI).
What the Template Contains
- Historical Data: Includes United Bankshares, Inc.'s (UBSI) past financials and baseline forecasts.
- DCF and Levered DCF Models: Detailed templates to calculate United Bankshares, Inc.'s (UBSI) intrinsic value.
- WACC Sheet: Pre-built calculations for Weighted Average Cost of Capital.
- Editable Inputs: Modify key drivers like growth rates, EBITDA %, and CAPEX assumptions.
- Quarterly and Annual Statements: A complete breakdown of United Bankshares, Inc.'s (UBSI) financials.
- Interactive Dashboard: Visualize valuation results and projections dynamically.
Disclaimer
All information, articles, and product details provided on this website are for general informational and educational purposes only. We do not claim any ownership over, nor do we intend to infringe upon, any trademarks, copyrights, logos, brand names, or other intellectual property mentioned or depicted on this site. Such intellectual property remains the property of its respective owners, and any references here are made solely for identification or informational purposes, without implying any affiliation, endorsement, or partnership.
We make no representations or warranties, express or implied, regarding the accuracy, completeness, or suitability of any content or products presented. Nothing on this website should be construed as legal, tax, investment, financial, medical, or other professional advice. In addition, no part of this site—including articles or product references—constitutes a solicitation, recommendation, endorsement, advertisement, or offer to buy or sell any securities, franchises, or other financial instruments, particularly in jurisdictions where such activity would be unlawful.
All content is of a general nature and may not address the specific circumstances of any individual or entity. It is not a substitute for professional advice or services. Any actions you take based on the information provided here are strictly at your own risk. You accept full responsibility for any decisions or outcomes arising from your use of this website and agree to release us from any liability in connection with your use of, or reliance upon, the content or products found herein.