
|
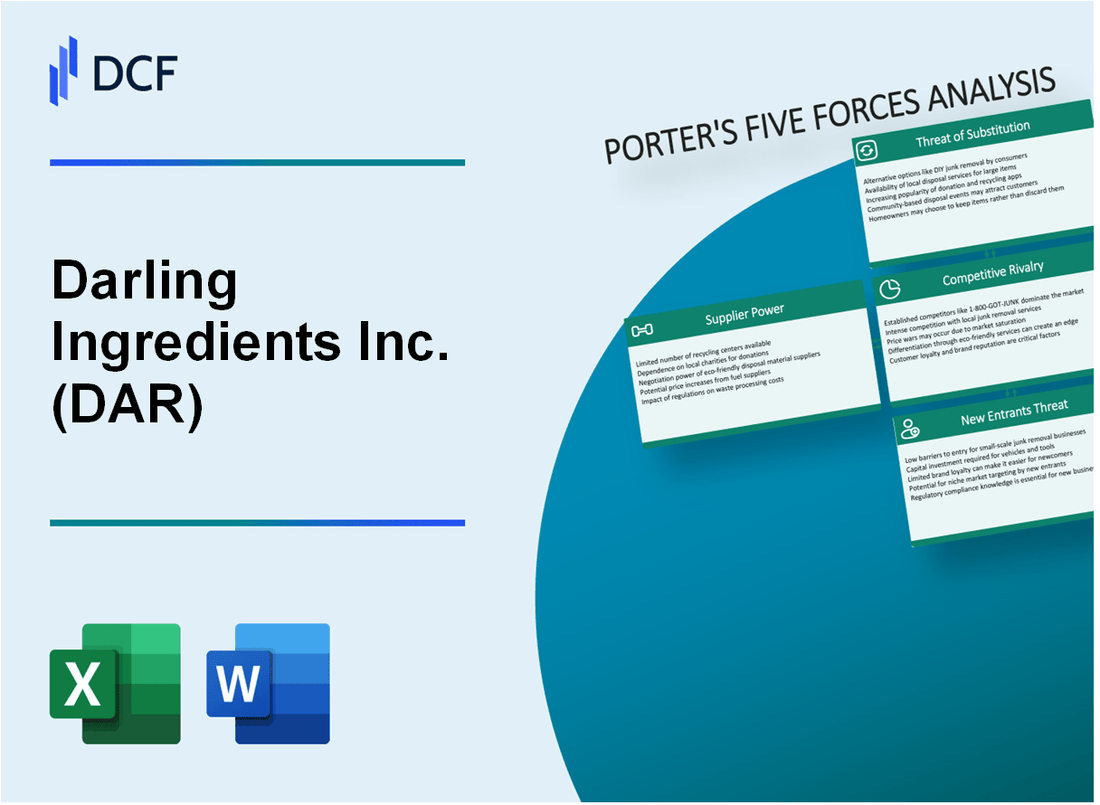
Análisis de las 5 Fuerzas de Darling Ingredients Inc. (DAR) [Actualizado en enero de 2025] |
Completamente Editable: Adáptelo A Sus Necesidades En Excel O Sheets
Diseño Profesional: Plantillas Confiables Y Estándares De La Industria
Predeterminadas Para Un Uso Rápido Y Eficiente
Compatible con MAC / PC, completamente desbloqueado
No Se Necesita Experiencia; Fáciles De Seguir
Darling Ingredients Inc. (DAR) Bundle
En el panorama dinámico del procesamiento de subproductos animales y soluciones de ingredientes sostenibles, Darling Ingredients Inc. (DAR) navega por un complejo ecosistema de las fuerzas del mercado que dan forma a su posicionamiento estratégico. Desde tecnologías de representación especializadas hasta innovaciones de combustibles renovables, la compañía opera en la intersección de la sostenibilidad ambiental, las cadenas de suministro agrícola y la fabricación de ingredientes avanzados, enfrentando un entorno competitivo multifacético que exige una adaptación continua y la resistencia estratégica.
Darling Ingredients Inc. (DAR) - Las cinco fuerzas de Porter: poder de negociación de los proveedores
Número limitado de subproductos animales especializados y proveedores de recolección de residuos
A partir de 2024, la industria de la representación tiene aproximadamente 25-30 principales empresas de representación en los Estados Unidos. Darling Ingredients Inc. opera dentro de un mercado concentrado con proveedores especializados limitados.
| Categoría de proveedor | Número de proveedores | Cuota de mercado (%) |
|---|---|---|
| Proveedores de desechos de procesamiento de carne | 12 | 65% |
| Proveedores de subproductos de aves de corral | 8 | 22% |
| Proveedores de desechos de mariscos | 5 | 13% |
Concentración de proveedores de la industria de representación
Los 5 principales proveedores que controlan aproximadamente el 68% de la cadena de suministro total de materia prima en América del Norte.
- La base de proveedores consolidada reduce la competencia
- Mayor potencial para el apalancamiento de la negociación de precios
- Opciones de abastecimiento alternativas limitadas
Dependencia potencial de abastecimiento de materia prima consistente
Los ingredientes queridos obtienen aproximadamente 2.5 millones de toneladas de subproductos animales anualmente. En 2023, los costos de adquisición de materias primas de la compañía fueron de $ 487.3 millones.
| Fuente de materia prima | Volumen anual (toneladas) | Porcentaje de suministro total |
|---|---|---|
| Plantas de procesamiento de carne | 1,250,000 | 50% |
| Procesamiento de aves de corral | 750,000 | 30% |
| Industria de mariscos | 500,000 | 20% |
Costos moderados de cambio de proveedor
Los requisitos de procesamiento especializados crean costos de cambio estimados entre $ 1.2 millones a $ 3.5 millones por transición del proveedor.
- Costos de reconfiguración de equipos técnicos: $ 750,000 - $ 1.5 millones
- Gastos de cumplimiento y certificación: $ 450,000 - $ 1 millón
- Potencial de interrupción operativa: 3-6 meses
Darling Ingredients Inc. (DAR) - Las cinco fuerzas de Porter: poder de negociación de los clientes
Diversidad de clientes y segmentos de mercado
Darling Ingredients Inc. atiende a múltiples industrias con segmentos clave de clientes que incluyen:
- Fabricantes de alimentos
- Compañías agrícolas
- Productores de combustible renovable
- Fabricantes de alimentos para mascotas
Análisis de concentración de clientes
| Categoría de clientes | Porcentaje de ingresos | Clientes clave |
|---|---|---|
| Industria alimentaria | 35% | Tyson Foods, Cargill |
| Combustible renovable | 28% | BP, concha |
| Alimentación agrícola | 22% | Purina, adm |
| Comida para mascotas | 15% | Mars Petcare, Nestlé |
Métricas de sensibilidad de precios
Volatilidad del precio de los productos básicos impactos en el poder de negociación del cliente:
- Rango de fluctuación del precio de la comida de proteínas: 12-18% anual
- Variación del precio del mercado de combustible renovable: 15-22%
- Duración promedio del contrato: 6-12 meses
Demanda de sostenibilidad
Requisitos de sostenibilidad del cliente:
- El 88% de los clientes solicitan informes de impacto ambiental
- El 73% prioriza a los proveedores con estrategias de reducción de carbono
- Los clientes de combustible renovable exigen una intensidad de carbono 40% menor
Darling Ingredients Inc. (DAR) - Las cinco fuerzas de Porter: rivalidad competitiva
Presencia de competidores establecidos en la representación y el procesamiento de ingredientes
A partir de 2024, Darling Ingredients Inc. enfrenta la competencia de los jugadores clave en el mercado de procesamiento de la representación y los ingredientes:
| Competidor | Segmento de mercado | Ingresos anuales |
|---|---|---|
| Tyson Foods | Procesamiento de proteínas | $ 47.1 mil millones (2023) |
| JBS S.A. | Procesamiento de carne | $ 68.4 mil millones (2023) |
| Smithfield Foods | Subproductos animales | $ 15.8 mil millones (2023) |
Tendencias de consolidación en subproductos animales y sector de gestión de residuos
Los datos de consolidación del mercado revelan:
- Las 5 compañías principales controlan el 62% del mercado de renderizado
- La actividad de fusión y adquisición aumentó en un 18% en 2023
- Valor de transacción promedio en el sector: $ 124 millones
Diferenciación a través de la innovación tecnológica y las prácticas de sostenibilidad
Inversiones de innovación tecnológica:
| Área de innovación | Monto de la inversión | Impacto del mercado |
|---|---|---|
| Tecnologías de combustible renovable | $ 87.3 millones (2023) | Crecimiento de la participación de mercado de 7.2% |
| Procesamiento sostenible | $ 53.6 millones (2023) | Reducidas emisiones de carbono en un 22% |
Competencia regional y global en mercados de combustible e ingredientes renovables
Métricas de competencia del mercado global:
- Tamaño del mercado global de combustible renovable: $ 202.7 mil millones (2024)
- Darling ingredientes cuota de mercado: 4.3%
- Índice de intensidad competitiva: 0.78 (alta competencia)
Darling Ingredients Inc. (DAR) - Las cinco fuerzas de Porter: amenaza de sustitutos
Fuentes de proteínas alternativas en los mercados de alimentación animal
Tamaño del mercado de proteínas alternativas globales: $ 10.9 mil millones en 2022, proyectados para llegar a $ 17.4 mil millones para 2027.
| Fuente de proteínas | Cuota de mercado (%) | Tasa de crecimiento anual |
|---|---|---|
| Proteína de insectos | 3.2% | 27.4% |
| Proteína de algas | 2.7% | 22.8% |
| Proteína unicelular | 1.9% | 19.6% |
Tecnologías emergentes de ingredientes a base de plantas y sintéticas
Valor de mercado global de ingredientes basados en plantas: $ 85.6 mil millones en 2023.
- Se espera que el mercado de fermentación de precisión alcance los $ 3.1 mil millones para 2028
- Mercado de ingredientes de biología sintética proyectado en $ 14.7 mil millones para 2026
- Las inversiones en agricultura celular alcanzaron los $ 1.2 mil millones en 2022
Métodos de producción de combustible y biodiesel renovables competitivos
| Tipo de combustible | Volumen de producción (mil millones de galones) | Costo por galón |
|---|---|---|
| Biodiésel | 2.5 | $4.20 |
| Diesel renovable | 1.7 | $4.85 |
| Etanol celulósico | 0.3 | $5.50 |
Economía circular y soluciones alternativas de gestión de residuos
Tamaño del mercado de la economía circular global: $ 338.8 mil millones en 2023.
- Mercado de tecnologías de residuos a energía: $ 43.6 mil millones
- Inversión de BioConversion Technologies: $ 2.3 mil millones anualmente
- Crecimiento del mercado de reciclaje de residuos orgánicos: 15.2% CAGR
Darling Ingredients Inc. (DAR) - Las cinco fuerzas de Porter: amenaza de nuevos participantes
Requisitos de inversión de capital
Darling Ingredients Inc. reportó propiedad total, planta y equipo de $ 1.87 mil millones al 31 de diciembre de 2022. Los costos de construcción de la instalación inicial de la instalación oscilan entre $ 50 millones y $ 150 millones dependiendo de la capacidad de procesamiento.
| Categoría de inversión | Rango de costos estimado |
|---|---|
| Construcción de instalaciones de procesamiento | $ 50M - $ 150M |
| Tecnología de representación avanzada | $ 20M - $ 75M |
| Infraestructura de gestión de residuos | $ 30M - $ 100M |
Barreras regulatorias
La industria de la representación se enfrenta Regulaciones estrictas de seguridad ambiental y alimentaria.
- Costos de cumplimiento de la EPA: $ 500,000 - $ 2 millones anuales
- Certificación de ingredientes alimentarios del USDA: inversión inicial de $ 250,000
- Permisos de gestión de residuos a nivel estatal: $ 100,000 - $ 750,000
Barreras tecnológicas
Darling Ingredients invirtió $ 87.4 millones en investigación y desarrollo en 2022.
| Capacidad tecnológica | Nivel de inversión |
|---|---|
| Tecnología de procesamiento sostenible | $ 45.3 millones |
| Sistemas de representación avanzados | $ 32.1 millones |
Economías de escala
Los ingredientes queridos procesaron 16.4 mil millones de libras de materias primas en 2022, lo que representa ventajas de escala significativas.
- Ingresos anuales: $ 5.2 mil millones
- Cuota de mercado en la industria de la representación: 22%
- Costo por unidad de procesamiento: 15-20% más bajo que los competidores más pequeños
Darling Ingredients Inc. (DAR) - Porter's Five Forces: Competitive rivalry
You're analyzing the competitive rivalry for Darling Ingredients Inc. (DAR), and honestly, the renewable diesel side of the house is where the heat is right now. The market is volatile, and that volatility is being amplified by capacity additions across the board.
The North America Renewable Diesel Market is definitely adjusting to oversupply challenges, even as long-term demand, driven by clean fuel policies, remains strong through 2030. This oversupply dynamic puts immediate pressure on margins, which we saw reflected in the Fuel segment's performance in early 2025, even though the core business is holding up well. For instance, Darling Ingredients' own Diamond Green Diesel (DGD) joint venture has a massive capacity of over 1.2 billion gallons annually, but when competitors are also adding capacity, the market gets tight fast.
To give you a sense of the core business strength that's offsetting this, Darling Ingredients Inc. projects its core ingredients (Feed/Food segments, excluding DGD) Adjusted EBITDA for the full year 2025 to be in the range of $875-900 million. That stability is critical when the fuel market is experiencing these swings.
The rivalry is sustained because the capital investment required for this business is significant, creating high exit barriers. Building out the necessary specialized assets, like the extraction capacity needed for hydrolyzed collagen, is a very large investment. This means players are more likely to fight for market share than to simply walk away, keeping the rivalry intense.
The competitive landscape in renewable fuels is populated by major energy players, while the rendering and protein side faces established global giants. Here's a quick look at how the renewable diesel landscape is structured, showing that while DGD is a leader, it operates within a crowded field:
| Metric/Entity | Value/Data Point |
|---|---|
| Darling Ingredients Global Animal By-Product Market Share | 15% |
| Top Three Global Renewable Diesel Players Market Share (Combined) | Nearly 40.5% |
| U.S. Renewable Diesel Market Size (2025 Estimate) | USD 12.33 billion |
| DGD Annual Renewable Fuel Capacity | More than 1.2 billion gallons |
Competition in the rendering and protein space involves established names, and in the renewable fuel sector, Darling Ingredients Inc. competes directly with companies that have massive balance sheets and existing infrastructure. The sheer number of players confirms the fragmentation and the resulting competitive pressure:
- Major renewable diesel competitors include Neste Corporation, Chevron Corporation, Phillips 66, Marathon Petroleum Corporation, and Shell plc.
- In the broader renewable fuel market, players like BP, Eni, and Total Energies are also active.
- The Feed and Food segments face competition from global entities, including giants like Cargill, which is also noted as a player in the renewable fuel space.
- The need to secure feedstock, like used cooking oil, is a point of friction, with competition in this area expected to tighten in 2025.
If onboarding takes 14+ days for a new feedstock contract, margin erosion from rivals can quickly eat into the projected $875-900 million core EBITDA target.
Finance: draft 13-week cash view by Friday.
Darling Ingredients Inc. (DAR) - Porter's Five Forces: Threat of substitutes
You're looking at the substitutes threatening Darling Ingredients Inc.'s business, and honestly, the landscape is split between renewable fuels and alternative proteins. For the protein side, plant-based proteins were a $11.3 billion market in 2023, but projections for 2025 vary; some estimates put the global market size at USD 27.48 billion or even USD 64.07 billion. This segment substitutes animal proteins in feed and food, which is Darling Ingredients' core business outside of fuel.
When you look at the fuel side, petroleum diesel remains the primary, low-cost substitute for the renewable diesel Darling Ingredients Inc. produces via its Diamond Green Diesel (DGD) joint venture. The threat from petroleum is heavily influenced by government support for renewables. For instance, the Trump administration added nearly $40 billion in new federal subsidies for oil, gas, and coal in 2025, sending an additional $4 billion out the door each year for the next decade. This shows the direct financial support needed to keep renewable diesel competitive against established fossil fuels.
The regulatory environment is definitely shifting the economics, which directly impacts the substitution threat. The $1 per gallon blender's tax credit (BTC) expired on January 1, 2025, replaced by the Section 45Z Clean Fuel Production Credit, which only applies to domestic production. This policy change immediately put imports at a relative economic disadvantage. In the first half of 2025 (1H25), U.S. renewable diesel imports averaged just 5,000 barrels per day (b/d), a massive drop from 33,000 b/d in 1H24. Still, domestic consumption was also weak, with renewable diesel use down about 30% in 1H25 compared to the same period in 2024.
Renewable diesel competes with ethanol and other biofuels, but its molecular structure gives it an edge. DGD's renewable diesel meets the ASTM International's standard for Diesel Fuel Oils (D-975), and it is 100% compatible with existing engines and infrastructure. This 'drop-in' capability lowers the hurdle for end-users to switch away from petroleum diesel or even other biofuels like ethanol.
Switching costs for customers in the ingredient space are low if plant-based alternatives offer better value, but in the fuel segment, the regulatory framework dictates much of the demand. Darling Ingredients Inc. is strategically positioned to benefit from policies favoring domestic sourcing, as the company processes 20% of the U.S. animal fat supply and recycles 40% of domestic UCO. The DGD joint venture has a capacity of more than 1.2 billion gallons annually.
Regulatory changes can instantly reduce the threat of petroleum substitution by making renewables more financially viable. For example, Darling Ingredients Inc. announced an agreement in September 2025 to sell $125 million of production tax credits generated by DGD under the IRA, with proceeds scheduled for receipt later in 2025. Furthermore, Q1 2025 saw the Fuel segment's Combined Adjusted EBITDA at 11.8% of the total $195.8 million in combined adjusted EBITDA, showing the immediate impact of the tax credit transition.
Here's a quick view of the fuel market dynamics impacting substitution:
| Metric | Value | Context/Period |
|---|---|---|
| Renewable Diesel Imports (Average) | 5,000 b/d | 1H25 |
| Renewable Diesel Imports (Average) | 33,000 b/d | 1H24 |
| Renewable Diesel Consumption Change | Down 30% | 1H25 vs 1H24 |
| DGD Annual Production Capacity | 1.2 billion gallons | As of late 2025 |
| DGD Tax Credit Sale Proceeds | $125 million | Scheduled for receipt in late 2025 |
And for the ingredient side, the competition from plant-based alternatives is growing, as you can see:
- Plant-Based Protein Market (Estimated 2025)
- USD 27.48 billion
- USD 20.3 billion (Ingredients Market)
- USD 64.07 billion
- Plant-Based Protein Market (2023)
- $11.3 billion [cite: User Requirement]
Darling Ingredients Inc. (DAR) - Porter's Five Forces: Threat of new entrants
You're assessing the barriers to entry in the sustainable ingredients and renewable fuels space, and honestly, the capital required to even compete with Darling Ingredients Inc. is staggering. Building a facility that can rival their scale, especially in renewable diesel, requires a massive upfront commitment.
Consider the Diamond Green Diesel (DGD) joint venture. Its total annual production capacity reached approximately 1.2 billion gallons of renewable diesel after the DGD 3 plant came online. That Port Arthur, Texas, expansion alone required an investment of $1.45 billion. For Darling Ingredients Inc. itself, capital expenditures for the first nine months of fiscal year 2025 totaled $224.0 million. A new entrant must secure financing for similar, multi-billion dollar infrastructure projects just to achieve meaningful scale, which is a huge hurdle.
The sheer scale of Darling Ingredients Inc. provides a structural cost advantage over smaller, non-integrated rendering competitors. While a precise 15-20% cost advantage figure is not publicly quantified in recent filings, the data clearly shows the benefit of their integrated model. Darling Ingredients Inc. processes approximately 10% of the world's inedible meat by-products and is the largest collector and processor of used cooking oil in North America. This feedstock control translates directly into operational strength; for instance, the Feed segment, which supplies DGD, saw its adjusted EBITDA increase 11.3% to $135.9 million in Q2 2025, representing over 50% of the company's total combined adjusted EBITDA that quarter.
Regulatory complexity and permitting create significant time barriers that a new player cannot easily overcome. Navigating the Low Carbon Fuel Standard (LCFS) and the Renewable Fuel Standard (RFS) requires deep expertise and time. Uncertainty around the EPA's finalization of Renewable Volume Obligations (RVOs) is a known overhang. Despite this, Darling Ingredients Inc. is monetizing federal incentives, expecting to generate a total of around $300 million in Production Tax Credits (PTCs) for 2025, with $125 million agreed upon for sale in Q3 2025 alone. Securing these credits requires established operations and regulatory compliance that new entrants lack.
Securing a consistent, low-carbon feedstock supply chain is defintely a major hurdle. The market for Used Cooking Oil (UCO), a key feedstock, is valued at $8.56 billion in 2025 and is projected to reach $17.2 billion by 2035. Competing for this finite, specialized supply against the world's largest processor is extremely difficult for a startup.
Renewable diesel margin volatility discourages new, non-integrated players because the returns are too unpredictable for the required investment. The DGD joint venture's EBITDA per gallon sold was only $0.36 in Q2 2025, down from $0.49 the prior year. Furthermore, Darling's share of DGD EBITDA was negative $3 million in Q3 2025, compared to a positive $39 million in Q3 2024. This instability in renewable fuel margins, driven by policy and feedstock pricing, makes the massive capital commitment required for a new refinery too risky without the diversification Darling Ingredients Inc. offers from its core ingredients business.
Here are some key figures illustrating the scale and financial pressures:
| Metric | Value | Period/Context |
|---|---|---|
| DGD Renewable Diesel Capacity | 1.2 Billion Gallons/Year | Total Capacity |
| DGD 3 Plant Investment | $1.45 Billion | CAPEX for Port Arthur Plant |
| Darling Ingredients CAPEX (9M 2025) | $224.0 Million | First Nine Months of 2025 |
| Estimated 2025 PTC Generation | Approx. $300 Million | Total Expected for 2025 |
| UCO Market Value (2025 Est.) | $8.56 Billion | Used Cooking Oil Market Size |
| DGD EBITDA per Gallon | $0.36 | Q2 2025 Average |
| Darling's Share of DGD EBITDA | -$3 Million | Q3 2025 |
The structural barriers to entry are substantial, built on capital, integration, and regulatory navigation:
- High Initial Capital: Requires multi-billion dollar investment for renewable diesel scale.
- Feedstock Control: Darling processes 10% of the world's inedible meat by-products.
- Regulatory Hurdles: Navigating LCFS/RFS requires time and expertise.
- Margin Risk: Q2 2025 renewable fuel EBITDA margins were $0.36 per gallon.
- Permitting Timelines: Significant time required for environmental and operational approvals.
Finance: draft 13-week cash view by Friday.
Disclaimer
All information, articles, and product details provided on this website are for general informational and educational purposes only. We do not claim any ownership over, nor do we intend to infringe upon, any trademarks, copyrights, logos, brand names, or other intellectual property mentioned or depicted on this site. Such intellectual property remains the property of its respective owners, and any references here are made solely for identification or informational purposes, without implying any affiliation, endorsement, or partnership.
We make no representations or warranties, express or implied, regarding the accuracy, completeness, or suitability of any content or products presented. Nothing on this website should be construed as legal, tax, investment, financial, medical, or other professional advice. In addition, no part of this site—including articles or product references—constitutes a solicitation, recommendation, endorsement, advertisement, or offer to buy or sell any securities, franchises, or other financial instruments, particularly in jurisdictions where such activity would be unlawful.
All content is of a general nature and may not address the specific circumstances of any individual or entity. It is not a substitute for professional advice or services. Any actions you take based on the information provided here are strictly at your own risk. You accept full responsibility for any decisions or outcomes arising from your use of this website and agree to release us from any liability in connection with your use of, or reliance upon, the content or products found herein.