
|
Valoración DCF de John Bean Technologies Corporation (JBT) |
Completamente Editable: Adáptelo A Sus Necesidades En Excel O Sheets
Diseño Profesional: Plantillas Confiables Y Estándares De La Industria
Predeterminadas Para Un Uso Rápido Y Eficiente
Compatible con MAC / PC, completamente desbloqueado
No Se Necesita Experiencia; Fáciles De Seguir
John Bean Technologies Corporation (JBT) Bundle
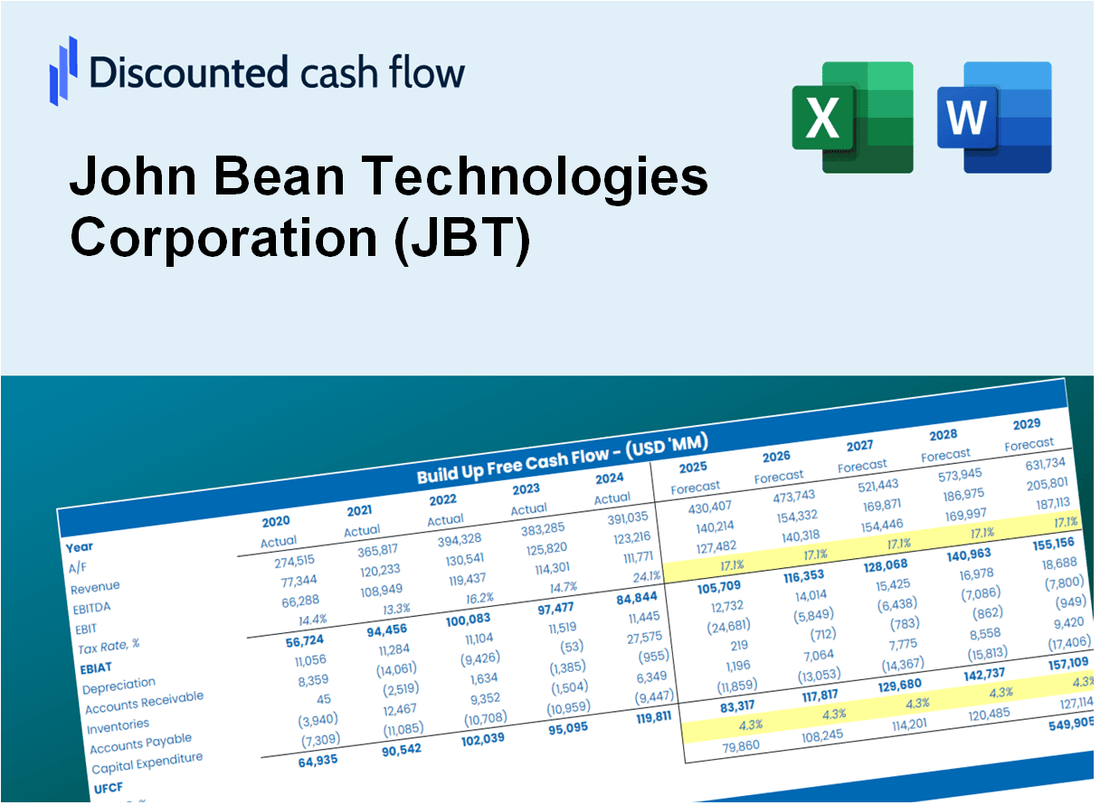
Como inversor o analista, la calculadora DCF de John Bean Technologies Corporation (JBT) es su herramienta de referencia para una valoración precisa. Equipado con datos reales de John Bean Technologies Corporation, puede ajustar fácilmente los pronósticos y observar instantáneamente sus efectos.
What You Will Receive
- Authentic JBT Financial Data: Pre-filled with John Bean Technologies Corporation’s historical and projected figures for accurate analysis.
- Completely Customizable Template: Easily adjust key inputs such as revenue growth, WACC, and EBITDA %.
- Instant Calculations: Watch JBT’s intrinsic value update in real-time as you make adjustments.
- Professional Valuation Tool: Tailored for investors, analysts, and consultants aiming for precise DCF outcomes.
- User-Friendly Interface: Intuitive layout and straightforward instructions suitable for all skill levels.
Key Features
- Comprehensive DCF Calculator: Features detailed unlevered and levered DCF valuation models tailored for John Bean Technologies Corporation (JBT).
- WACC Calculator: Pre-configured Weighted Average Cost of Capital sheet with adjustable inputs specific to JBT.
- Customizable Forecast Assumptions: Adjust growth rates, capital expenditures, and discount rates according to JBT's financial outlook.
- Integrated Financial Ratios: Evaluate profitability, leverage, and efficiency ratios for John Bean Technologies Corporation (JBT).
- Visual Dashboard and Charts: Graphical representations summarize essential valuation metrics for straightforward analysis.
How It Works
- Download: Obtain the pre-built Excel file containing John Bean Technologies Corporation’s (JBT) financial data.
- Customize: Modify projections, such as revenue growth, EBITDA %, and WACC.
- Update Automatically: The intrinsic value and NPV calculations refresh in real-time.
- Test Scenarios: Generate various forecasts and instantly compare the results.
- Make Decisions: Leverage the valuation findings to inform your investment approach.
Why Choose This Calculator for John Bean Technologies Corporation (JBT)?
- Designed for Experts: A sophisticated tool favored by industry analysts, CFOs, and financial consultants.
- Accurate Financial Data: JBT’s historical and projected financial information preloaded for precision.
- Flexible Scenario Analysis: Easily simulate various forecasts and assumptions to evaluate outcomes.
- Comprehensive Outputs: Automatically computes intrinsic value, NPV, and essential financial metrics.
- User-Friendly Interface: Step-by-step guidance ensures a smooth calculation process.
Who Should Use This Product?
- Individual Investors: Gain insights to make informed decisions about buying or selling JBT stock (JBT).
- Financial Analysts: Enhance valuation processes with comprehensive financial models tailored for JBT (JBT).
- Consultants: Provide clients with accurate and timely valuation insights related to JBT (JBT).
- Business Owners: Learn from the valuation strategies of JBT (JBT) to inform your own business decisions.
- Finance Students: Explore valuation methodologies using real-time data and case studies involving JBT (JBT).
What the Template Contains
- Pre-Filled DCF Model: John Bean Technologies Corporation’s (JBT) financial data preloaded for immediate use.
- WACC Calculator: Detailed calculations for Weighted Average Cost of Capital.
- Financial Ratios: Evaluate JBT’s profitability, leverage, and efficiency.
- Editable Inputs: Change assumptions such as growth, margins, and CAPEX to fit your scenarios.
- Financial Statements: Annual and quarterly reports to support detailed analysis.
- Interactive Dashboard: Easily visualize key valuation metrics and results.
Disclaimer
All information, articles, and product details provided on this website are for general informational and educational purposes only. We do not claim any ownership over, nor do we intend to infringe upon, any trademarks, copyrights, logos, brand names, or other intellectual property mentioned or depicted on this site. Such intellectual property remains the property of its respective owners, and any references here are made solely for identification or informational purposes, without implying any affiliation, endorsement, or partnership.
We make no representations or warranties, express or implied, regarding the accuracy, completeness, or suitability of any content or products presented. Nothing on this website should be construed as legal, tax, investment, financial, medical, or other professional advice. In addition, no part of this site—including articles or product references—constitutes a solicitation, recommendation, endorsement, advertisement, or offer to buy or sell any securities, franchises, or other financial instruments, particularly in jurisdictions where such activity would be unlawful.
All content is of a general nature and may not address the specific circumstances of any individual or entity. It is not a substitute for professional advice or services. Any actions you take based on the information provided here are strictly at your own risk. You accept full responsibility for any decisions or outcomes arising from your use of this website and agree to release us from any liability in connection with your use of, or reliance upon, the content or products found herein.