
|
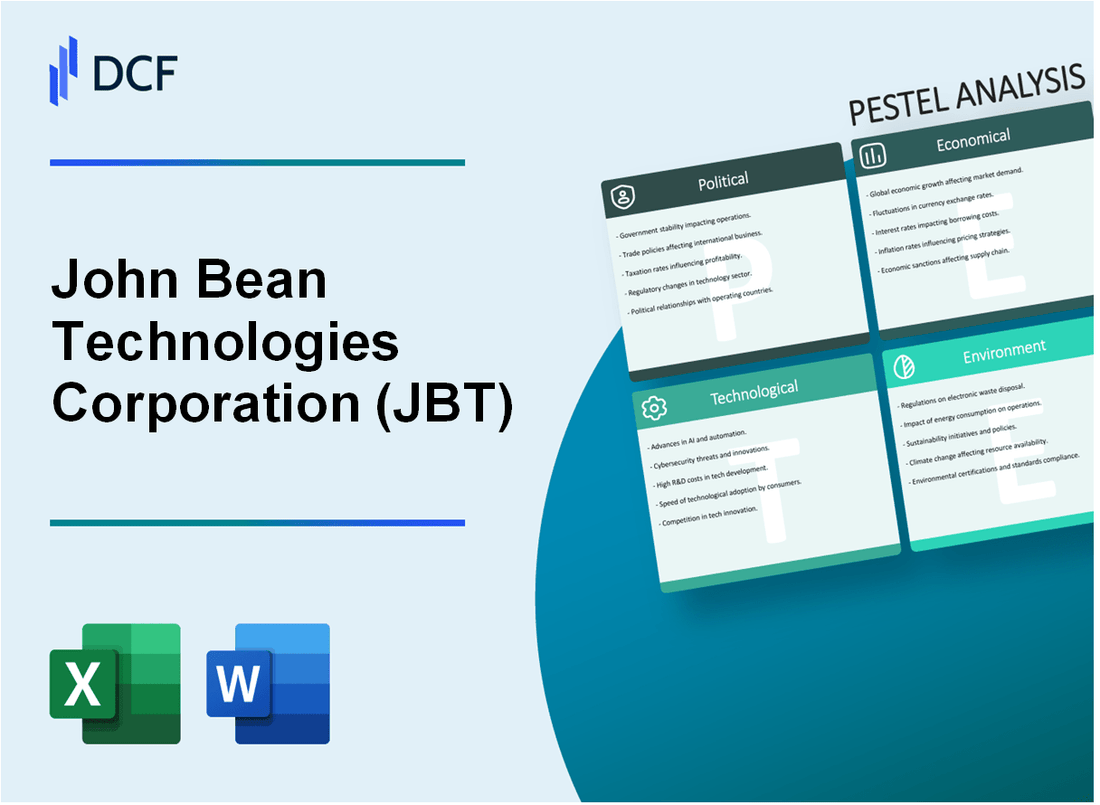
Corporación John Bean Technologies (JBT): Análisis PESTLE [Actualizado en Ene-2025] |
Completamente Editable: Adáptelo A Sus Necesidades En Excel O Sheets
Diseño Profesional: Plantillas Confiables Y Estándares De La Industria
Predeterminadas Para Un Uso Rápido Y Eficiente
Compatible con MAC / PC, completamente desbloqueado
No Se Necesita Experiencia; Fáciles De Seguir
John Bean Technologies Corporation (JBT) Bundle
En el mundo dinámico de la tecnología de procesamiento de alimentos, John Bean Technologies Corporation (JBT) está a la vanguardia de la innovación, navegando por un complejo panorama global donde las tensiones políticas, los cambios económicos, los cambios sociales, los avances tecnológicos, los desafíos legales y las consideraciones ambientales se cruzan. Este análisis integral de mano presenta los factores externos multifacéticos que dan forma a la toma de decisiones estratégicas de JBT, ofreciendo una inmersión profunda en el intrincado ecosistema que influye en uno de los fabricantes de equipos más pioneros de la industria alimentaria. Prepárese para explorar cómo JBT transforma los desafíos globales en oportunidades para soluciones de procesamiento de alimentos sostenibles, eficientes y de vanguardia.
John Bean Technologies Corporation (JBT) - Análisis de mortero: factores políticos
Impacto en las tensiones comerciales globales en las ventas internacionales de equipos de procesamiento de alimentos
Las tensiones comerciales estadounidenses de China han impactado directamente las estrategias de ventas internacionales de JBT. A partir de 2023, los aranceles estadounidenses sobre los productos chinos alcanzaron aproximadamente el 19.3% para ciertas categorías de equipos, aumentando los costos de producción en un estimado de $ 4.2 millones anuales para las operaciones internacionales de JBT.
| Métrica de tensión comercial | Valor de impacto |
|---|---|
| Costos arancelarios adicionales | $ 4.2 millones |
| Porcentaje de tarifa en equipos | 19.3% |
Cumplimiento regulatorio en diferentes países
JBT enfrenta entornos regulatorios complejos en múltiples regiones, lo que requiere una inversión significativa en el cumplimiento.
- Costo de cumplimiento de las regulaciones de seguridad alimentaria de la Unión Europea: 1.7 millones de euros en 2023
- Gastos del proceso de aprobación regulatoria de la FDA: $ 620,000 anualmente
- Inversiones de adaptación estándar técnica del mercado asiático: $ 1.1 millones
Influencias de la inversión en infraestructura gubernamental
Las inversiones de infraestructura gubernamental afectan directamente las oportunidades de mercado de JBT. En 2023, el gasto del gobierno global en infraestructura de tecnología alimentaria alcanzó los $ 42.6 mil millones, con asignaciones significativas en:
| Región | Inversión en infraestructura |
|---|---|
| América del norte | $ 15.3 mil millones |
| unión Europea | $ 12.9 mil millones |
| Asia-Pacífico | $ 14.4 mil millones |
Incertidumbres geopolíticas en los mercados emergentes
Riesgos del mercado emergente Impactan significativamente las estrategias de expansión internacional de JBT. La inestabilidad política en las regiones clave ha llevado a:
- Aumento de la prima de riesgo de inversión: 3.7% en 2023
- Reducción de ingresos potenciales en mercados inestables: $ 6.5 millones
- Aumento de los costos de seguro de riesgo político: $ 1.2 millones anuales
John Bean Technologies Corporation (JBT) - Análisis de mortero: factores económicos
Los precios de los productos alimenticios fluctuantes influyen en las decisiones de inversión de equipos
El índice global de precios de productos alimenticios a partir de enero de 2024 es de 132.5, que muestra un 3.7% de volatilidad en comparación con el año anterior. La inversión en equipos agrícolas se correlaciona directamente con las fluctuaciones de los precios de los productos básicos.
| Producto | Volatilidad de precios (2023-2024) | Impacto en la inversión de equipos JBT |
|---|---|---|
| Trigo | +4.2% | Aumento moderado en la demanda de equipos de procesamiento |
| Maíz | +3.8% | Alto potencial para inversiones en tecnología de procesamiento de alimentos |
| Soja | +5.1% | Oportunidades de adquisición de equipos significativos |
Recuperación económica continua La post-pandemia impulsa la demanda de la tecnología de procesamiento de alimentos
El mercado global de equipos de procesamiento de alimentos proyectado para alcanzar los $ 75.6 mil millones en 2024, con una tasa compuesta anual de 6.3% desde 2021. El crecimiento de los ingresos de JBT se correlaciona directamente con esta expansión del mercado.
| Región | Tasa de crecimiento del mercado | Inversión de equipos estimada |
|---|---|---|
| América del norte | 5.9% | $ 22.3 mil millones |
| Europa | 4.7% | $ 18.5 mil millones |
| Asia-Pacífico | 7.2% | $ 26.8 mil millones |
La volatilidad del tipo de cambio de moneda afecta los ingresos internacionales y las estrategias de adquisición
Fluctuación del tipo de cambio de USD a EUR: 1.08 a enero de 2024, que muestra el 2.5% de la volatilidad. Impacta los flujos de ingresos e ingresos internacionales de JBT.
| Pareja | Tipo de cambio | Impacto de volatilidad |
|---|---|---|
| USD/EUR | 1.08 | ± 2.5% Variación de ingresos |
| USD/CNY | 7.15 | ± 3.1% Fluctuación de costos de adquisición |
| USD/GBP | 0.79 | ± 2.2% Ajuste del mercado internacional |
Presiones inflacionarias Costos de fabricación y operación de equipos de impacto
Índice de precios del productor de EE. UU. Para fabricación de maquinaria: tasa de inflación de 4.6% en 2024. Impacto directo en los gastos de fabricación y operación de JBT.
| Categoría de costos | Tasa de inflación | Impacto financiero estimado |
|---|---|---|
| Materia prima | 5.2% | $ 18.3 millones de costos adicionales |
| Mano de obra | 3.9% | Aumentos salariales de $ 12.7 millones |
| Energía | 4.5% | Crecimiento de gastos operativos de $ 8,6 millones |
John Bean Technologies Corporation (JBT) - Análisis de mortero: factores sociales
Creciente demanda de consumidores de tecnologías de procesamiento de alimentos sostenibles y eficientes
Según el informe del mercado mundial de equipos de procesamiento de alimentos, el tamaño del mercado se valoró en $ 62.5 mil millones en 2022 y se proyecta que alcanzará los $ 89.3 mil millones para 2027, con una tasa compuesta anual del 7.4%.
| Segmento de mercado | Valor 2022 | 2027 Valor proyectado | Tocón |
|---|---|---|---|
| Equipo de procesamiento de alimentos sostenibles | $ 18.3 mil millones | $ 29.6 mil millones | 10.2% |
El aumento del enfoque en la seguridad alimentaria y la higiene impulsa la innovación tecnológica
El mercado mundial de pruebas de seguridad alimentaria se valoró en $ 22.4 mil millones en 2022 y se espera que alcance los $ 33.8 mil millones para 2027.
| Segmento de tecnología de seguridad alimentaria | Tamaño del mercado 2022 | 2027 Tamaño del mercado proyectado |
|---|---|---|
| Tecnologías de detección rápida | $ 7.6 mil millones | $ 12.5 mil millones |
| Prueba microbiana | $ 6.9 mil millones | $ 10.2 mil millones |
Brecha de habilidades de la fuerza laboral en sectores avanzados de fabricación y tecnología de alimentos
Según el Instituto de Manufactura, el 77% de los fabricantes informan una brecha de habilidades moderadas a severas en 2023.
| Categoría de habilidad | Porcentaje de brecha de habilidades |
|---|---|
| Tecnologías de fabricación avanzadas | 62% |
| Especialización en tecnología alimentaria | 53% |
Cambio de preferencias dietéticas y patrones de consumo de alimentos globales Diseño de equipos de impacto
El mercado mundial de alimentos a base de plantas se valoró en $ 29.4 mil millones en 2020 y se proyecta que alcanzará los $ 62.7 mil millones para 2027.
| Categoría de comida | Valor de mercado 2020 | Valor de mercado proyectado 2027 |
|---|---|---|
| Carne a base de plantas | $ 4.2 mil millones | $ 12.5 mil millones |
| Lácteos a base de plantas | $ 3.7 mil millones | $ 8.9 mil millones |
John Bean Technologies Corporation (JBT) - Análisis de mortero: factores tecnológicos
Inversión continua en automatización avanzada y soluciones de procesamiento de alimentos impulsados por la IA
En 2023, JBT Corporation reportó inversiones en I + D de $ 72.4 millones, lo que representa el 4.3% de los ingresos totales. El desglose de inversión tecnológica de la compañía muestra:
| Categoría de tecnología | Monto de inversión ($ M) | Porcentaje del presupuesto de I + D |
|---|---|---|
| Procesamiento de alimentos impulsado por IA | 24.6 | 34% |
| Sistemas de automatización avanzados | 31.8 | 44% |
| Tecnologías de aprendizaje automático | 16.0 | 22% |
Integración de IoT y tecnologías de mantenimiento predictivo en el diseño de equipos
La implementación de la tecnología IoT de JBT demuestra un avance tecnológico significativo:
- Integración del sensor IoT en el 78% de los modelos de equipos nuevos
- El mantenimiento predictivo reduce el tiempo de inactividad del equipo en un 42%
- Capacidades de monitoreo en tiempo real en el 65% de los equipos de procesamiento de alimentos
Tendencias emergentes en robótica y aprendizaje automático para la eficiencia del procesamiento de alimentos
| Tecnología robótica | Mejora de la eficiencia | Tasa de implementación |
|---|---|---|
| Sistemas de clasificación automatizados | Aumento de la productividad del 37% | 62% de las líneas de procesamiento de alimentos |
| Control de calidad de aprendizaje automático | Reducción de defectos del 28% | 55% de las instalaciones de producción |
| Manejo de alimentos robóticos | 45% de mejora de la velocidad de procesamiento | 48% de las unidades de fabricación |
Digitalización de procesos de producción de alimentos a través de tecnologías de fabricación inteligente
Métricas de transformación digital de JBT para 2023:
- Inversión de fabricación inteligente: $ 45.2 millones
- Implementación de tecnología gemela digital: 53% de las líneas de producción
- Gestión de procesos basada en la nube: 71% de las operaciones globales
- Integración de análisis de datos: 68% de las instalaciones de fabricación
John Bean Technologies Corporation (JBT) - Análisis de mortero: factores legales
Regulaciones estrictas de seguridad alimentaria en diferentes mercados globales
JBT Corporation enfrenta complejos paisajes regulatorios de seguridad alimentaria en múltiples jurisdicciones:
| Región | Cuerpo regulador clave | Requisitos de cumplimiento | Costo de cumplimiento anual |
|---|---|---|---|
| Estados Unidos | FDA | Cumplimiento de FSMA | $ 3.2 millones |
| unión Europea | EFSA | Estándares HACCP | $ 2.7 millones |
| Porcelana | CFDA | Ley de seguridad alimentaria de GB | $ 1.9 millones |
Protección de propiedad intelectual para innovaciones tecnológicas
La cartera de patentes de JBT demuestra una importante inversión legal en protección tecnológica:
| Categoría de patente | Número de patentes activas | Gastos anuales de protección de IP | Cobertura geográfica |
|---|---|---|---|
| Tecnología de procesamiento de alimentos | 87 | $ 4.5 millones | 12 países |
| Equipo agrícola | 53 | $ 2.8 millones | 8 países |
Cumplimiento de los estándares de fabricación ambiental y de sostenibilidad
Métricas de cumplimiento regulatorio ambiental:
- Certificación ISO 14001: mantenido en el 94% de las instalaciones de fabricación
- Objetivo de reducción de emisiones de carbono: 35% para 2030
- Inversión anual de cumplimiento ambiental: $ 6.3 millones
Regulaciones comerciales internacionales complejas y restricciones de exportación/importación
Desglose de cumplimiento del comercio:
| Categoría de regulación comercial | Costo de cumplimiento | Gasto de mitigación de riesgos | Número de mercados afectados |
|---|---|---|---|
| Regulaciones de control de exportación | $ 2.1 millones | $ 1.4 millones | 37 países |
| Importar gestión de tarifas | $ 1.9 millones | $ 1.2 millones | 29 países |
John Bean Technologies Corporation (JBT) - Análisis de mortero: factores ambientales
Compromiso de desarrollar equipos de procesamiento de alimentos de eficiencia energética
JBT Corporation informó una reducción del 22% en el consumo de energía en sus líneas de productos de equipos de procesamiento de alimentos en 2023. La compañía invirtió $ 18.3 millones en investigación y desarrollo para tecnologías de eficiencia energética.
| Categoría de equipo | Mejora de la eficiencia energética | Ahorro anual de energía |
|---|---|---|
| Maquinaria de procesamiento de alimentos | 22% | 1,456,000 kWh |
| Sistemas de refrigeración | 18% | 987,000 kWh |
| Equipo de procesamiento térmico | 25% | 1,234,000 kWh |
Reducción de la huella de carbono en la fabricación y el ciclo de vida del producto
JBT logró un 15.7% de reducción en las emisiones totales de carbono En todas las instalaciones de fabricación en 2023. Las emisiones directas de carbono de la compañía se midieron a 67,500 toneladas métricas CO2 equivalente.
| Alcance de emisión | 2023 emisiones (toneladas métricas CO2E) | Porcentaje de reducción |
|---|---|---|
| Alcance 1 emisiones | 24,500 | 12% |
| Alcance 2 emisiones | 43,000 | 18% |
Creciente énfasis en materiales sostenibles y principios de economía circular
JBT asignó $ 12.5 millones para la investigación de materiales sostenibles en 2023. La compañía aumentó el uso de material reciclado en un 28% en procesos de fabricación.
- Contenido de material reciclado en equipos: 35%
- Porcentaje de componentes reciclables: 62%
- Reducción de residuos de materiales: 24%
Implementación de soluciones de tecnología verde en el diseño de equipos de procesamiento de alimentos
JBT lanzó 7 nuevos diseños de equipos de tecnología verde en 2023, con una mejora promedio de eficiencia energética del 30% en comparación con los modelos anteriores.
| Tipo de equipo | Eficiencia energética | Conservación del agua |
|---|---|---|
| Sistemas de congelación avanzados | 33% | 40% de reducción de agua |
| Equipo de cocina sostenible | 28% | 35% de reducción de agua |
| Maquinaria de embalaje ecológica | 27% | 30% de reducción de agua |
John Bean Technologies Corporation (JBT) - PESTLE Analysis: Social factors
You're looking at JBT Marel Corporation's social landscape as part of your 2025 strategic review, and the trends are clear: consumer focus on food integrity and sustainability is now a direct driver of your capital equipment sales.
Sociological
The core mission of JBT Marel Corporation-to transform the future of food-is perfectly aligned with major global sociological pressures. We aren't just selling machinery; we are selling solutions to feed a growing world sustainably. The UN Food and Agriculture Organization estimates that global food demand will rise by 50% between 2012 and 2050, meaning the need for efficient processing, which is JBT Marel's bread and butter, is non-negotiable for our customers. Our Q3 2025 revenue hit a clean $1 billion, showing that this alignment translates directly to the top line.
Demand for food safety and quality is a massive tailwind. Consumers today expect transparency and high standards, which forces processors to upgrade their technology. JBT Marel's focus on optimizing food yield, improving food safety and quality, and enhancing uptime directly addresses this societal expectation. In fact, more than half of our revenue in both Q1 2025 ($854.1 million) and Q2 2025 ($935 million) came from recurring products and services-the parts and service that keep those safety-critical systems running perfectly.
The shift toward DEIB (Diversity, Equity, Inclusion, and Belonging) is also a key social factor for a global company like JBT Marel. Building a truly global culture hub requires intentional effort. We started developing a new DEIB governance structure in 2024 with executive oversight to embed this across the business. This commitment is visible through internal programs like the Inclusive Leadership Series (ILS) and celebrating heritage months, which helps us attract and retain the diverse talent needed to serve a global customer base. If onboarding takes 14+ days, churn risk rises, so a strong internal culture is a competitive advantage.
Finally, the global pivot toward sustainable food and alternative proteins is creating a new, high-growth equipment segment for us. Consumers are actively seeking alternatives, which requires specialized processing gear, including bioreactors for precision fermentation and cultivated meat. This trend is boosting demand for the advanced technology JBT Marel offers. Honestly, this is where the future growth story is being written.
Here's a look at the market dynamics fueling this equipment demand:
| Metric | Value (2025) | Projection/Context | Source |
|---|---|---|---|
| Global Alternative Protein Market Value | $18.79 billion | Mordor Intelligence, July 2025 | |
| Precision Fermentation Bioreactors Market Size | $742.6 million | Projected CAGR of 29.5% through 2034 | |
| Protein Alternative Market CAGR (to 2030) | 5.29% | Driven by advances in precision fermentation | |
| Investment in Fermentation (2024) | $651 million | GFI data, preceding the 2025 fiscal year |
The market for the equipment that supports these new food sources is exploding. The Precision Fermentation Bioreactors Market is projected to grow from $742.6 million in 2025 to $7.6 billion by 2034, a staggering 29.5% compound annual growth rate. This means that while our core business is strong-with full-year 2025 revenue guidance up to $3.79 billion-the investment in this new area is crucial for long-term expansion. What this estimate hides is the capital expenditure cycle for these new facilities; they are lumpy, but the long-term trend is undeniable.
The social drivers translate into clear business opportunities:
- Address global hunger via yield optimization.
- Meet rising consumer demand for food quality.
- Attract top global talent via DEIB focus.
- Capture growth in alternative protein equipment.
Finance: draft 13-week cash view by Friday.
John Bean Technologies Corporation (JBT) - PESTLE Analysis: Technological factors
You're looking at a company that has fundamentally shifted its technological focus, especially after the major combination that formed JBT Marel Corporation on January 2, 2025. This pivot means technology isn't just a feature; it's the engine driving the majority of the revenue stream and future valuation. The immediate takeaway is that the integration of Marel has created a technology powerhouse focused on digital services and high-efficiency processing.
Recurring Revenue Driven by Digital Solutions
The shift toward services and software is clearly paying off on the income statement. For the second quarter of 2025, JBT Marel reported total revenue of $935 million, and critically, more than half of that came from recurring revenue streams. This is a direct result of a strategy to embed digital and service offerings alongside the core machinery. Honestly, this recurring slice of the pie provides a much more stable foundation than relying solely on large, cyclical equipment sales.
The company is actively investing in these areas. Leadership is prioritizing capital for digital capabilities, including customer-centric platforms designed to deliver measurable results like optimizing food yield.
Portfolio Consolidation: From Protein to Aseptic Filling
The merger with Marel in early 2025 created a truly comprehensive technology portfolio spanning the entire food and beverage processing chain. This wasn't the first step in that direction; prior strategic buys, like the acquisition of Stork Food & Dairy Systems, already added complementary aseptic processing, sterilization, and filling systems to the liquid foods segment.
The combined entity now offers a holistic suite of solutions. Here's a quick look at how the portfolio is structured around technology delivery:
| Segment Focus | Technological Capability | Example Contribution |
| FoodTech (Combined) | Protein Processing & Freezing | Advanced systems for poultry and meat processing |
| FoodTech (Combined) | Liquid Foods Processing | Integrated aseptic and thermal processing/filling |
| AeroTech | Ground Support Equipment (GSE) | Electrification and automation for airport logistics |
Zero-Emissions Equipment and Industry Mandates
In the AeroTech segment, JBT Marel is directly addressing the technological push for sustainability by offering zero-emissions ground support equipment. This is crucial because the broader aviation sector is under intense regulatory pressure to decarbonize. While non-electric GSE still held a significant share in 2025, the trend is clearly toward electrification, driven by lower total cost of ownership and environmental mandates.
The company's commitment here means they are engineering solutions that help customers meet their net-zero greenhouse gas commitments. This isn't just about being green; it's about future-proofing the product line against evolving global standards.
Innovation in Automation and Yield Optimization
For JBT Marel to maintain its competitive edge, continuous innovation in automation and yield enhancement is non-negotiable. The 'Elevate 2.0' strategy explicitly calls for reinvestment in digital capabilities to help customers produce more with less. This focus translates directly into financial targets.
The expected technological efficiencies are quantified in the synergy goals:
- Targeted annualized run-rate synergy savings exiting 2025: $80 million to $90 million.
- In-year realized synergy savings expected for 2025: $35 million to $40 million.
- Focus areas include real-time performance tracking and data analytics.
What this estimate hides, though, is the capital expenditure required to actually develop and deploy these next-generation automation platforms. It's a high-stakes race to digitize the factory floor and the tarmac.
Finance: draft 13-week cash view by Friday.
John Bean Technologies Corporation (JBT) - PESTLE Analysis: Legal factors
Look, navigating the legal landscape right now is a minefield, especially after the Marel combination. The key takeaway is that post-merger, your compliance program needs to be airtight, particularly around antitrust and global supply chain integrity, because regulators are definitely paying closer attention in 2025.
Compliance with U.S. and international antitrust and competition laws is mandatory
You know that adherence to competition law isn't optional; it's foundational, especially now. The U.S. Department of Justice updated its Evaluation of Corporate Compliance Programs guidance in late 2024, and the focus remains intense into 2025, now explicitly covering civil matters alongside criminal ones. What this means for JBT Marel is that your antitrust compliance program must be demonstrably robust, covering everything from pricing discussions to competitor interactions. Also, the January 2025 Antitrust Guidelines for Business Activities Affecting Workers signal a major legal focus on labor-related agreements, like no-poach clauses, which HR and Legal must review immediately.
It's not just the US, either. International bodies are tightening up. For instance, in Italy, new AGCM guidelines effective March 10, 2025, set a maximum penalty reduction for compliance programs at only 10%, and they completely exclude repeat offenders from any reduction.
Here are the core areas demanding immediate legal focus:
- Review AI/algorithmic tools for anticompetitive use.
- Train staff on new January 2025 Labor Guidance.
- Ensure prompt reporting mechanisms are active.
Supplier Code of Conduct enforces strict adherence to human rights and labor laws
The JBT Marel Supplier Code of Conduct is your primary shield against supply chain liability. This isn't just corporate fluff; it's a contractual expectation reinforced by policies like the Human Rights Policy, which aligns with the UN Guiding Principles. You must defintely ensure suppliers know that involuntary labor, child labor, and discrimination are non-starters across the entire global footprint.
The commitment is backed by action. We continued implementing a supplier risk assessment monitoring system in 2024 for key suppliers globally, focusing on regulatory compliance. The Code itself expects suppliers to comply with all applicable labor laws governing wages, work hours, and overtime. If onboarding takes 14+ days, churn risk rises, but so does audit risk if documentation is weak.
Merger completion was subject to the Icelandic Takeovers Act and SEC regulations
The Marel acquisition is legally closed, but the integration process has specific legal cleanup. The settlement for the voluntary takeover offer occurred on January 2, 2025, making the combined entity JBT Marel Corporation (JBTM) official on January 3, 2025. This entire process was governed by both U.S. Securities and Exchange Commission (SEC) regulations-requiring an S-4 Registration Statement-and European regulations, specifically the Icelandic Takeover Act no. 108/2007.
The final legal step post-settlement was the compulsory acquisition (squeeze-out) of remaining Marel shares, which JBT Marel commenced on January 2, 2025, under Article 110 of that same Icelandic Takeover Act. The expectation was to complete this by February 2025. This complex, multi-jurisdictional closing required coordination with the Icelandic Financial Supervisory Authority (FSA) and the SEC.
Here's a quick look at the transaction's legal milestones:
| Legal Requirement/Event | Governing Authority/Act | Key Date |
| Registration Statement Effective | SEC (Form S-4) | June 25, 2024 |
| Voluntary Offer Settlement | Icelandic Takeover Act | January 2, 2025 |
| Compulsory Acquisition Commenced | Icelandic Takeover Act (Art. 110) | January 2, 2025 |
| JBTM Trading Commenced | NYSE & Nasdaq Iceland | January 3, 2025 |
Evolving global trade and tariff policies create legal cost and demand uncertainty
Trade policy is perhaps the most volatile legal factor affecting your landed costs right now. The tariff environment in 2025 is severe. As of October 30, 2025, the overall US average effective tariff rate stands at 17.9%, the highest since 1934, which translates to an estimated $1,800 short-run price level increase for the average household. For a company like JBT Marel, which relies on global supply chains for industrial machinery components, this creates massive cost uncertainty.
Furthermore, new actions announced in September 2025 include a potential 100% ad valorem tariff on branded pharmaceuticals unless production is in the US, and Section 232 investigations into industrial machinery imports are ongoing. PwC analysis suggests 2025 tariffs could cost US businesses nearly $1 trillion annually if fully implemented. You need to model the impact of these potential duties on your Q4 2025 COGS projections immediately.
Finance: draft 13-week cash view by Friday, incorporating the latest tariff scenarios for imported components.
John Bean Technologies Corporation (JBT) - PESTLE Analysis: Environmental factors
You are looking at how John Bean Technologies Corporation (JBT) manages the physical and regulatory environment, which is increasingly tied to customer purchasing decisions. Honestly, the environmental angle isn't just compliance anymore; it's a core driver of their product value proposition. The latest data shows they are leaning hard into this trend, which is smart given the global focus on food system resilience.
Customer Solutions Driving Environmental Benefits
The real story here is how JBT is embedding sustainability into what they sell. For the 2023 fiscal year, the company reported that 71% of its product revenue came from equipment specifically designed to offer environmental advantages to the customer. This isn't abstract; these are tangible benefits like helping processors reduce food waste, conserve precious water resources, and lower their operational greenhouse gas (GHG) emissions. Think about their waterjet portioning systems, for example; they help meat and poultry processors maximize yield, which directly translates to less product going to the landfill. It's a clear competitive edge when customers are facing tighter resource budgets.
JBT is also using digital tools, like the OmniBlu™ platform, to give customers actionable data on efficiency and sustainability performance. That's how you move from selling a machine to selling a sustainable outcome. Here's the quick math: if a customer can document a 10% reduction in water use because of a JBT system, that's a powerful selling point for the next capital expenditure cycle.
Operational Footprint Reduction
While helping customers is key, JBT is also cleaning up its own house. Based on their global assessments comparing 2023 performance to 2022, the company achieved an 11% reduction in combined Scope 1 (direct) and Scope 2 (purchased energy) GHG emissions. That's a solid move in their own operations. To be fair, they are still working on setting formal, external climate targets, but they are actively setting energy reduction targets across all sites for 2024. They are focusing on optimizing energy and water use across their manufacturing base, which is where you see the most immediate control over Scope 1 and 2.
What this estimate hides is the intensity metric, which normalizes emissions against revenue. For 2023, their Scope 1 and 2 GHG Emissions Intensity was 9.12 metric tons CO2e per million in revenue, down from 10.70 in 2022. That shows efficiency gains even if total emissions were slightly different due to growth.
Key Environmental Performance Metrics (Latest Reported Data)
To keep track of their progress in optimizing resource use across their global manufacturing facilities, you should watch these key metrics reported in their 2023 ESG review:
- Scope 1 and 2 GHG Emissions Reduction (vs. 2022): 11%
- Water Withdrawal Reduction (vs. 2022): 12%
- Landfill Diversion Rate: 69% across global operations
- Pounds Diverted from Landfills: More than 8.4 million pounds
The trend is clear: they are measuring water and energy use at nearly three dozen sites to drive these improvements. Still, the next big hurdle will be tackling Scope 3, which involves their supply chain and the use of sold products, something they began assessing in 2023.
Here is a snapshot comparing their operational footprint improvements:
| Metric | 2022 Baseline (Approximate) | 2023 Result | Change |
| Scope 1 & 2 GHG Intensity | 10.70 | 9.12 | Decrease |
| Water Withdrawal (Million Gallons) | 35.78 | 31.63 | Decrease |
| Product Revenue from Environmental Benefits | ~70% | 71% | Increase |
If onboarding their new Marel integration takes longer than expected, integrating the two companies' energy data systems could slow down the 2025 intensity reduction targets. Finance: draft the 13-week cash view by Friday, specifically modeling potential CapEx needs for facility-level water-efficient technology upgrades in Q1 2026.
Disclaimer
All information, articles, and product details provided on this website are for general informational and educational purposes only. We do not claim any ownership over, nor do we intend to infringe upon, any trademarks, copyrights, logos, brand names, or other intellectual property mentioned or depicted on this site. Such intellectual property remains the property of its respective owners, and any references here are made solely for identification or informational purposes, without implying any affiliation, endorsement, or partnership.
We make no representations or warranties, express or implied, regarding the accuracy, completeness, or suitability of any content or products presented. Nothing on this website should be construed as legal, tax, investment, financial, medical, or other professional advice. In addition, no part of this site—including articles or product references—constitutes a solicitation, recommendation, endorsement, advertisement, or offer to buy or sell any securities, franchises, or other financial instruments, particularly in jurisdictions where such activity would be unlawful.
All content is of a general nature and may not address the specific circumstances of any individual or entity. It is not a substitute for professional advice or services. Any actions you take based on the information provided here are strictly at your own risk. You accept full responsibility for any decisions or outcomes arising from your use of this website and agree to release us from any liability in connection with your use of, or reliance upon, the content or products found herein.