
|
Valoración DCF de Macy's, Inc. (M) |
Completamente Editable: Adáptelo A Sus Necesidades En Excel O Sheets
Diseño Profesional: Plantillas Confiables Y Estándares De La Industria
Predeterminadas Para Un Uso Rápido Y Eficiente
Compatible con MAC / PC, completamente desbloqueado
No Se Necesita Experiencia; Fáciles De Seguir
Macy's, Inc. (M) Bundle
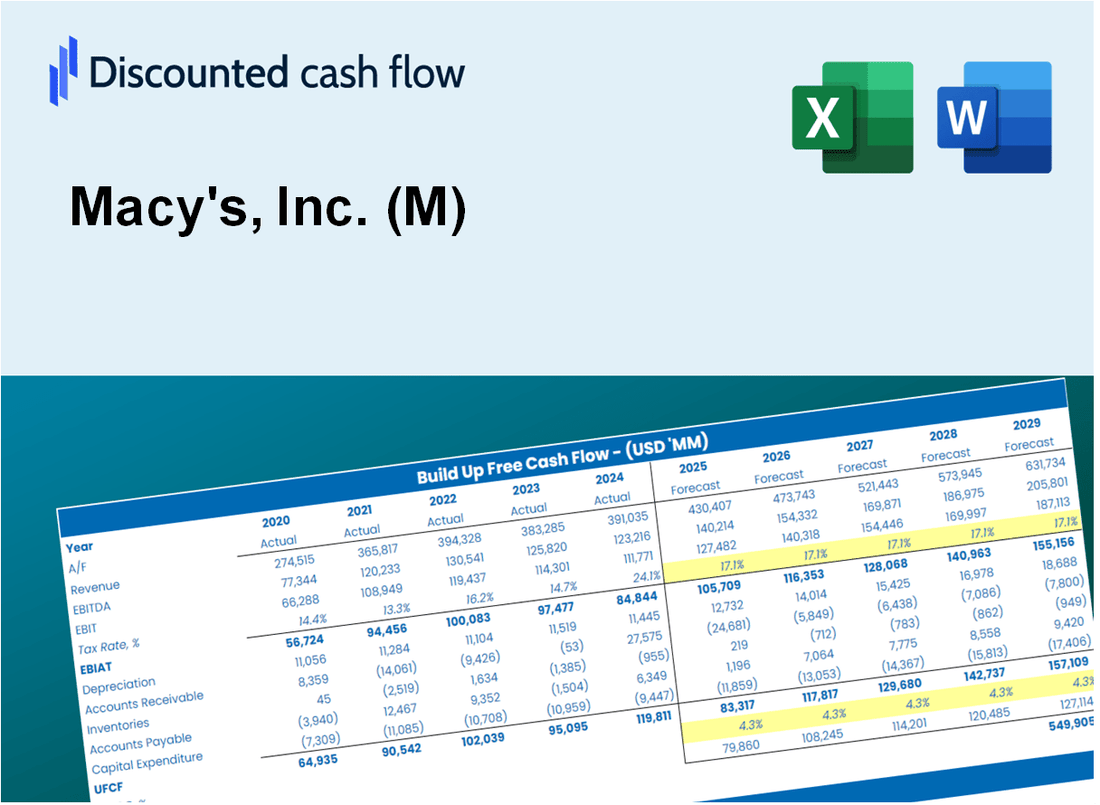
¡Simplifique la valoración de Macy's, Inc. (M) con esta calculadora DCF personalizable! Con el Real Macy's, Inc. (M) Financials y las entradas de pronóstico ajustables, puede probar escenarios y descubrir el valor razonable de Macy's, Inc. (M) en minutos.
What You Will Get
- Real Macy's Data: Preloaded financials – from revenue to EBIT – based on actual and projected figures.
- Full Customization: Adjust all critical parameters (yellow cells) like WACC, growth %, and tax rates.
- Instant Valuation Updates: Automatic recalculations to analyze the impact of changes on Macy's fair value.
- Versatile Excel Template: Tailored for quick edits, scenario testing, and detailed projections.
- Time-Saving and Accurate: Skip building models from scratch while maintaining precision and flexibility.
Key Features
- Comprehensive DCF Calculator: Offers detailed unlevered and levered DCF valuation models tailored for Macy's, Inc. (M).
- WACC Calculator: Features a pre-built Weighted Average Cost of Capital sheet with adjustable inputs specific to retail.
- Customizable Forecast Assumptions: Adjust growth rates, capital expenditures, and discount rates to fit Macy's business model.
- Integrated Financial Ratios: Evaluate profitability, leverage, and efficiency ratios for Macy's, Inc. (M).
- Interactive Dashboard and Charts: Visual representations summarize essential valuation metrics for straightforward analysis.
How It Works
- 1. Access the Template: Download and open the Excel file featuring Macy's, Inc. (M) preloaded data.
- 2. Adjust Assumptions: Modify key variables such as growth rates, WACC, and capital expenditures.
- 3. View Results Instantly: The DCF model automatically computes intrinsic value and NPV.
- 4. Analyze Scenarios: Evaluate various forecasts to assess different valuation results.
- 5. Present with Confidence: Deliver professional valuation insights to back your decisions.
Why Choose This Calculator for Macy's, Inc. (M)?
- All-in-One Solution: Features DCF, WACC, and key financial ratios for comprehensive analysis.
- Flexible Parameters: Modify the highlighted cells to explore different financial scenarios.
- In-Depth Analysis: Automatically computes Macy's intrinsic value and Net Present Value.
- Rich Data Set: Comes with historical and projected data to provide reliable benchmarks.
- High Standards: Perfect for financial analysts, investors, and business advisors.
Who Should Use This Product?
- Investors: Accurately estimate Macy's, Inc. (M)'s fair value before making investment decisions.
- CFOs: Leverage a professional-grade DCF model for financial reporting and analysis related to Macy's, Inc. (M).
- Consultants: Quickly adapt the template for valuation reports for clients interested in Macy's, Inc. (M).
- Entrepreneurs: Gain insights into financial modeling used by leading retail companies like Macy's, Inc. (M).
- Educators: Use it as a teaching tool to demonstrate valuation methodologies applicable to Macy's, Inc. (M).
What the Template Contains
- Pre-Filled DCF Model: Macy's, Inc. (M) financial data preloaded for immediate use.
- WACC Calculator: Detailed calculations for Weighted Average Cost of Capital.
- Financial Ratios: Evaluate Macy's, Inc. (M) profitability, leverage, and efficiency.
- Editable Inputs: Change assumptions such as growth, margins, and CAPEX to fit your scenarios.
- Financial Statements: Annual and quarterly reports to support detailed analysis.
- Interactive Dashboard: Easily visualize key valuation metrics and results.
Disclaimer
All information, articles, and product details provided on this website are for general informational and educational purposes only. We do not claim any ownership over, nor do we intend to infringe upon, any trademarks, copyrights, logos, brand names, or other intellectual property mentioned or depicted on this site. Such intellectual property remains the property of its respective owners, and any references here are made solely for identification or informational purposes, without implying any affiliation, endorsement, or partnership.
We make no representations or warranties, express or implied, regarding the accuracy, completeness, or suitability of any content or products presented. Nothing on this website should be construed as legal, tax, investment, financial, medical, or other professional advice. In addition, no part of this site—including articles or product references—constitutes a solicitation, recommendation, endorsement, advertisement, or offer to buy or sell any securities, franchises, or other financial instruments, particularly in jurisdictions where such activity would be unlawful.
All content is of a general nature and may not address the specific circumstances of any individual or entity. It is not a substitute for professional advice or services. Any actions you take based on the information provided here are strictly at your own risk. You accept full responsibility for any decisions or outcomes arising from your use of this website and agree to release us from any liability in connection with your use of, or reliance upon, the content or products found herein.