
|
Valoración DCF de Marriott International, Inc. (MAR) |
Completamente Editable: Adáptelo A Sus Necesidades En Excel O Sheets
Diseño Profesional: Plantillas Confiables Y Estándares De La Industria
Predeterminadas Para Un Uso Rápido Y Eficiente
Compatible con MAC / PC, completamente desbloqueado
No Se Necesita Experiencia; Fáciles De Seguir
Marriott International, Inc. (MAR) Bundle
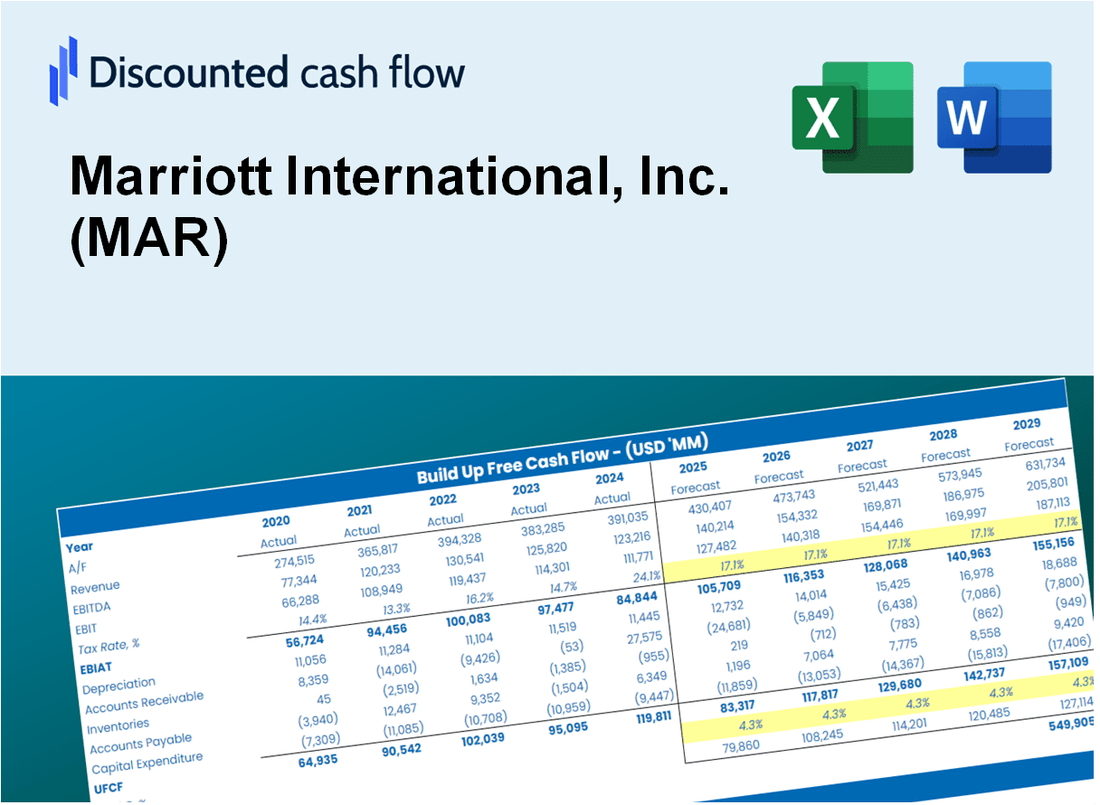
¡Simplifique la valoración de Marriott International, Inc. (MAR) con esta calculadora DCF personalizable! Con Real Marriott International, Inc. (MAR) financieras y aportes de pronóstico ajustables, puede probar escenarios y descubrir el valor razonable de Marriott International, Inc. (MAR) en minutos.
What You Will Get
- Real Marriott Data: Preloaded financials – from revenue to EBIT – based on actual and projected figures.
- Full Customization: Adjust all critical parameters (yellow cells) like WACC, growth %, and tax rates.
- Instant Valuation Updates: Automatic recalculations to analyze the impact of changes on Marriott’s fair value.
- Versatile Excel Template: Tailored for quick edits, scenario testing, and detailed projections.
- Time-Saving and Accurate: Skip building models from scratch while maintaining precision and flexibility.
Key Features
- Comprehensive DCF Calculator: Features detailed unlevered and levered DCF valuation models tailored for Marriott International, Inc. (MAR).
- WACC Calculator: Pre-configured Weighted Average Cost of Capital sheet with customizable parameters.
- Adjustable Forecast Assumptions: Alter growth rates, capital expenditures, and discount rates as needed.
- Integrated Financial Ratios: Evaluate profitability, leverage, and efficiency ratios specific to Marriott International, Inc. (MAR).
- Interactive Dashboard and Charts: Visual representations summarize essential valuation metrics for straightforward analysis.
How It Works
- Step 1: Download the Excel file.
- Step 2: Review pre-entered Marriott data (historical and projected).
- Step 3: Adjust key assumptions (yellow cells) based on your analysis.
- Step 4: View automatic recalculations for Marriott’s intrinsic value.
- Step 5: Use the outputs for investment decisions or reporting.
Why Choose This Calculator?
- Accuracy: Utilizes real Marriott financials to ensure precise data.
- Flexibility: Allows users to easily test and adjust inputs as needed.
- Time-Saving: Eliminate the complexity of creating a DCF model from the ground up.
- Professional-Grade: Crafted with the expertise and usability expected at the CFO level.
- User-Friendly: Intuitive design makes it accessible for users without extensive financial modeling skills.
Who Should Use This Product?
- Hotel Investors: Develop comprehensive and accurate valuation models for assessing hotel portfolios.
- Corporate Finance Teams: Evaluate valuation scenarios to inform strategic decisions within the hospitality sector.
- Consultants and Advisors: Offer clients precise valuation insights for Marriott International, Inc. (MAR) stock.
- Students and Educators: Utilize real-world data to enhance learning and teaching in financial modeling.
- Travel Industry Enthusiasts: Gain insights into how hospitality companies like Marriott are valued in the marketplace.
What the Template Contains
- Comprehensive DCF Model: Editable template with detailed valuation calculations tailored for Marriott International, Inc. (MAR).
- Real-World Data: Marriott’s historical and projected financials preloaded for thorough analysis.
- Customizable Parameters: Adjust WACC, growth rates, and tax assumptions to explore various scenarios.
- Financial Statements: Complete annual and quarterly breakdowns for enhanced insights into Marriott's performance.
- Key Ratios: Built-in analysis for profitability, efficiency, and leverage specific to the hospitality industry.
- Dashboard with Visual Outputs: Charts and tables providing clear, actionable results for decision-making.
Disclaimer
All information, articles, and product details provided on this website are for general informational and educational purposes only. We do not claim any ownership over, nor do we intend to infringe upon, any trademarks, copyrights, logos, brand names, or other intellectual property mentioned or depicted on this site. Such intellectual property remains the property of its respective owners, and any references here are made solely for identification or informational purposes, without implying any affiliation, endorsement, or partnership.
We make no representations or warranties, express or implied, regarding the accuracy, completeness, or suitability of any content or products presented. Nothing on this website should be construed as legal, tax, investment, financial, medical, or other professional advice. In addition, no part of this site—including articles or product references—constitutes a solicitation, recommendation, endorsement, advertisement, or offer to buy or sell any securities, franchises, or other financial instruments, particularly in jurisdictions where such activity would be unlawful.
All content is of a general nature and may not address the specific circumstances of any individual or entity. It is not a substitute for professional advice or services. Any actions you take based on the information provided here are strictly at your own risk. You accept full responsibility for any decisions or outcomes arising from your use of this website and agree to release us from any liability in connection with your use of, or reliance upon, the content or products found herein.