
|
Análisis de 5 fuerzas de Belpointe PREP, LLC (OZ) [Actualizado en enero de 2025] |
Completamente Editable: Adáptelo A Sus Necesidades En Excel O Sheets
Diseño Profesional: Plantillas Confiables Y Estándares De La Industria
Predeterminadas Para Un Uso Rápido Y Eficiente
Compatible con MAC / PC, completamente desbloqueado
No Se Necesita Experiencia; Fáciles De Seguir
Belpointe PREP, LLC (OZ) Bundle
Sumerja el panorama estratégico de Belpointe Prep, el ecosistema de inversión de la zona de oportunidad de LLC, donde la intrincada danza de las fuerzas del mercado revela un entorno empresarial complejo y matizado. Al diseccionar las cinco fuerzas de Michael Porter, descubrimos la dinámica crítica que da forma al posicionamiento competitivo de esta plataforma de inversión especializada, desde el delicado equilibrio de poder de los proveedores hasta las sofisticadas demandas de los inversores exigentes que buscan oportunidades transformadoras de impuestos en el desarrollo inmobiliario y comercial.
Belpointe Prep, LLC (OZ) - Las cinco fuerzas de Porter: poder de negociación de los proveedores
Número limitado de administradores de fondos de zona de oportunidades especializadas
A partir de 2024, hay aproximadamente 92 administradores de fondos de la zona de oportunidades en los Estados Unidos. Belpointe Prep, LLC opera en un mercado altamente especializado con opciones de proveedores limitados.
| Categoría de proveedor | Número de proveedores | Costo anual promedio |
|---|---|---|
| Administradores de fondos de Oz | 92 | $187,500 |
| Consultores de cumplimiento | 43 | $125,000 |
| Servicios legales especializados | 37 | $265,000 |
Cumplimiento y experiencia regulatoria
Requisitos de cumplimiento regulatorio para las inversiones de la zona de oportunidad exige experiencia especializada. El panorama de cumplimiento involucra regulaciones complejas de múltiples agencias federales.
- Requisitos de cumplimiento de la Sección 1400Z-2 del IRS
- Directrices del Departamento del Tesoro
- Mandatos de informes de la SEC
- Regulaciones de la zona de oportunidad a nivel estatal
Posibles altos costos de los servicios especializados de gestión de fondos
Los servicios especializados de gestión de fondos para las inversiones de la zona de oportunidad demuestran estructuras de costos significativas:
| Tipo de servicio | Costo anual promedio | Rango de costos |
|---|---|---|
| Administración de fondos | $187,500 | $150,000 - $225,000 |
| Monitoreo de cumplimiento | $95,000 | $75,000 - $135,000 |
| Servicios de asesoramiento legal | $265,000 | $200,000 - $325,000 |
Infraestructura tecnológica y legal de nicho de mercado
El ecosistema de inversión de la zona de oportunidad requiere una infraestructura tecnológica y legal sofisticada con requisitos específicos.
- Software especializado de seguimiento de inversiones
- Plataformas de gestión de cumplimiento
- Sistemas de informes avanzados
- Soluciones seguras de gestión de datos
Belpointe Prep, LLC (OZ) - Las cinco fuerzas de Porter: poder de negociación de los clientes
Alta sofisticación de inversores en el panorama de inversiones de la zona de oportunidad
A partir de 2024, los inversores de Opportunity Zone demuestran perfiles de inversión sofisticados con las siguientes características:
- Media neta: $ 1.2 millones
- Ingresos anuales promedio: $ 325,000
- Inversión de capital típica en fondos de OZ: $ 250,000 a $ 750,000
| Segmento de inversores | Porcentaje | Preferencia de inversión |
|---|---|---|
| Individuos de alto patrimonio | 62% | Desarrollo inmobiliario |
| Inversores institucionales | 23% | Inversión comercial |
| Oficinas familiares | 15% | Cartera mixta |
Inversores que buscan inversiones inmobiliarias e comerciales con ventajas de impuestos
Métricas de reducción de ganancias de capital y reducción de capital para inversiones en la zona de oportunidad:
- Aplazamiento de impuestos máximos: hasta el 31 de diciembre de 2026
- Reducción de impuestos potenciales de las ganancias de capital: hasta el 15%
- Ahorro total de impuestos potenciales: aproximadamente el 10-15% de la inversión inicial
Demanda de gestión de fondos de OZ transparente y compatible
| Métrico de cumplimiento | Expectativa del inversor |
|---|---|
| Informes regulatorios | Divulgaciones detalladas trimestrales |
| Seguimiento de inversiones | Monitoreo del rendimiento en tiempo real |
| Verificación de cumplimiento | Confirmación de auditoría de terceros |
Potencial para la elección selectiva de inversores entre las plataformas OZ en competencia
Métricas de paisaje competitivos:
- Número total de fondos activos de OZ: 327
- Tamaño promedio del fondo: $ 52 millones
- Tasa de cambio de plataforma de inversores: 18% anual
| Criterio de selección | Clasificación de prioridad del inversor |
|---|---|
| Rastro | Primero |
| Estructura de tarifas | Segundo |
| Diversidad de inversiones | Tercero |
Belpointe Prep, LLC (OZ) - Las cinco fuerzas de Porter: rivalidad competitiva
Creciente número de empresas de gestión de fondos de zona de oportunidad
A partir de 2024, hay aproximadamente 252 fondos de zona de oportunidad calificadas que administran activamente inversiones en todo el país. Belpointe Prep, LLC opera en un mercado con un estimado de $ 15.7 mil millones en activos del fondo de la zona de oportunidades totales.
| Categoría de fondos | Número total | Activos totales bajo administración |
|---|---|---|
| Fondos OZ enfocados en bienes raíces | 189 | $ 12.3 mil millones |
| Fondos de empresas comerciales/operativas | 63 | $ 3.4 mil millones |
Diferenciación competitiva a través de la estrategia de inversión y el rendimiento
Métricas clave de rendimiento para fondos de la zona de oportunidad:
- Rango promedio de rendimiento anual: 6.2% - 8.7%
- Tamaño mediano del fondo: $ 42.5 millones
- Período de retención de inversión típica: 7-10 años
Cumplimiento regulatorio como un factor competitivo clave
Los costos de cumplimiento para los fondos de la zona de oportunidad promedian $ 275,000 anuales, lo que representa una barrera significativa para la entrada al mercado.
| Componente de cumplimiento | Costo anual estimado |
|---|---|
| Servicios legales | $125,000 |
| Contabilidad e informes | $95,000 |
| Presentación regulatoria | $55,000 |
Tamaño limitado del mercado con base de inversores concentrados
Demografía de los inversores para fondos de la zona de oportunidad:
- Inversores acreditados totales: 13.9 millones
- Inversores estimados de Oz Fund: 34,500
- Inversión promedio por inversor: $ 456,000
La concentración geográfica muestra que el 62% de las inversiones de fondos de la zona de oportunidad se originan en California, Nueva York y Texas.
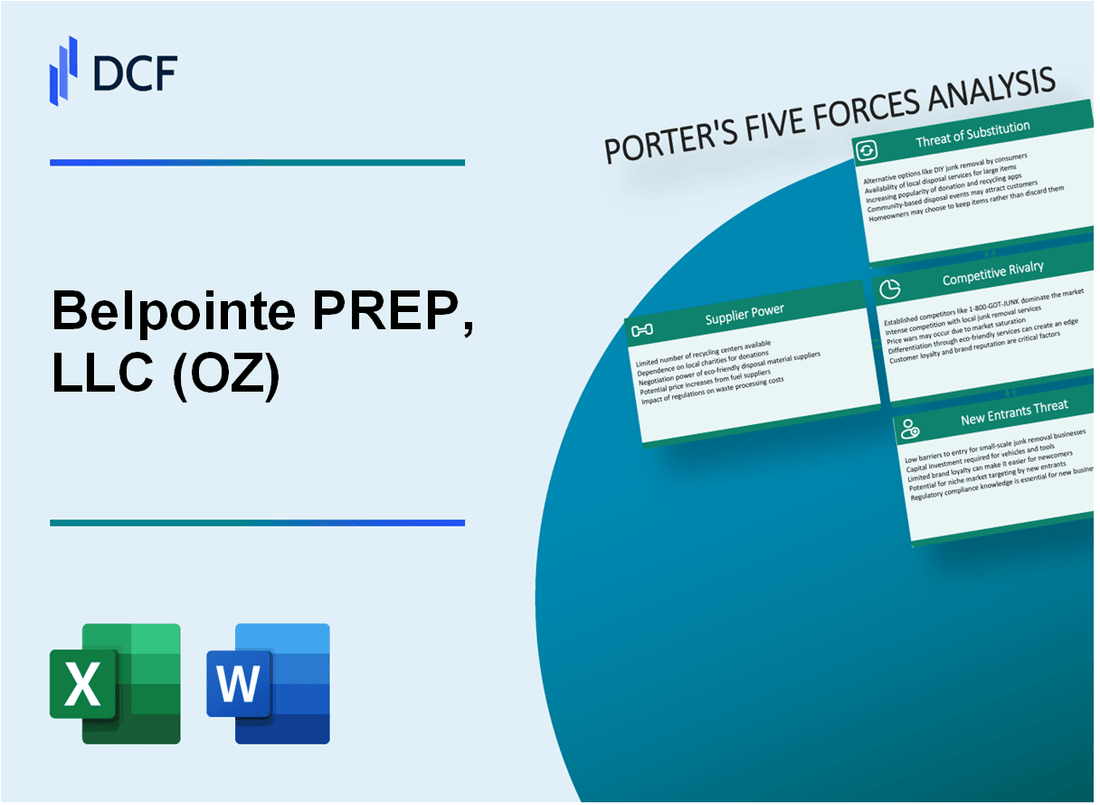
Belpointe Prep, LLC (Oz) - Las cinco fuerzas de Porter: amenaza de sustitutos
Vehículos tradicionales de inversión inmobiliaria
Capitalización de mercado de REIT en los Estados Unidos: $ 1.3 billones a partir del cuarto trimestre de 2023.
| Vehículo de inversión | Valor de mercado total | Retorno anual |
|---|---|---|
| REITES EN EQUIDAD | $ 1.1 billones | 7.2% |
| REIT hipotecarios | $ 180 mil millones | 4.5% |
| Inversiones de propiedad directa | $ 500 mil millones | 8.3% |
Estrategias alternativas de inversión con ventajas fiscales
Tamaño total del mercado de inversión de impuestos: $ 27.5 billones en 2023.
- Sección 1031 Volumen de transacción total de intercambio: $ 107 mil millones
- Inversiones de la zona de oportunidad: $ 75 mil millones desplegados
- Inversiones inmobiliarias de IRA autodirigidas: $ 42 mil millones
Plataformas emergentes de crowdfunding e inversión digital
| Plataforma | Capital total recaudado | Número de inversores |
|---|---|---|
| Fondos | $ 2.5 mil millones | 230,000 |
| Realtymogul | $ 1.8 mil millones | 180,000 |
| Crowdsstreet | $ 3.2 mil millones | 275,000 |
Opciones de inversión de capital privado y capital de riesgo
Inversión inmobiliaria de capital privado Activos totales: $ 1.2 billones en 2023.
| Tipo de inversión | Capital total | Retorno promedio |
|---|---|---|
| Equidad privada de bienes raíces | $ 850 mil millones | 12.5% |
| Capital de riesgo de bienes raíces | $ 350 mil millones | 15.3% |
Belpointe Prep, LLC (Oz) - Las cinco fuerzas de Porter: amenaza de nuevos participantes
Barreras regulatorias significativas de entrada en la gestión de fondos de OZ
Según el Departamento del Tesoro de EE. UU., A partir de 2023, solo 349 fondos de oportunidad calificados (QOF) estaban registrados activamente. Los requisitos de cumplimiento regulatorio incluyen:
| Requisito regulatorio | Complejidad de cumplimiento |
|---|---|
| Registro de la SEC | Obligatorio para fondos superiores a $ 150 millones |
| Certificación del IRS | Prueba de inversión de activos estricta del 90% |
| Informes anuales | Requerido el formulario detallado 8996 envío |
Alto cumplimiento y requisitos de experiencia legal
La gestión de fondos de la zona de oportunidad exige experiencia legal especializada:
- Costo promedio de cumplimiento legal: $ 75,000 - $ 250,000 anualmente
- Tamaño mínimo del equipo legal: 3-5 abogados especializados
- Certificaciones requeridas: Serie 7, Serie 63 Licencias
Capital e infraestructura tecnológica
| Componente de infraestructura | Inversión estimada |
|---|---|
| Configuración de tecnología inicial | $ 500,000 - $ 1.2 millones |
| Sistemas de ciberseguridad | $ 150,000 - $ 350,000 anualmente |
| Software de cumplimiento | $ 75,000 - $ 200,000 anualmente |
Requisitos de conocimiento especializados
Mandato de regulaciones de inversión de la zona de oportunidad:
- Período mínimo de inversión: 10 años
- Conocimiento de aplazamiento de impuestos sobre ganancias de capital
- Comprensión de datos económicos detallados a nivel del tracto
Belpointe PREP, LLC (OZ) - Porter's Five Forces: Competitive rivalry
You're analyzing Belpointe PREP, LLC (OZ) in a market where capital flow is heavily influenced by tax incentives, so understanding the competitive rivalry is key. The competition for tax-advantaged capital is definitely a major factor here, putting Belpointe PREP, LLC in a space with numerous private Qualified Opportunity Funds (QOFs).
Direct competition also comes from large, established Real Estate Investment Trusts (REITs) that operate in the same geographic markets as Belpointe PREP, LLC's assets in Florida, Connecticut, and Tennessee. While REITs don't share the QOF structure, their scale and established market presence create a baseline of rivalry for tenants and development opportunities.
Still, Belpointe PREP, LLC's unique structure offers a significant competitive edge against those private QOFs. Belpointe PREP, LLC is the first and only Qualified Opportunity Fund listed on a national securities exchange, the NYSE American under the ticker "OZ". This public listing provides a level of liquidity and transparency that private funds simply cannot match, which is a powerful differentiator for attracting capital.
The company is signaling a long-term, aggressive growth strategy through its development efforts. Here's a quick look at the scale of the operation as of late 2025, which frames the resources being deployed against competitors:
| Metric | Value as of Q3 2025 / Latest Report |
|---|---|
| Total Assets | $570.8 million |
| Debt, net | $251.4 million |
| Total Project Pipeline (Estimated Cost) | Over $1.3 billion |
| Pipeline Units | Over 2,500 units |
| NAV per Class A Unit (as of 6/30/2025) | $116.74 |
This pipeline, representing an approximate total project cost exceeding $1.3 billion, shows Belpointe PREP, LLC is committed to scaling up its asset base significantly.
However, the current operational results show a heavy reliance on the successful lease-up of these new assets to offset costs. The Q3 2025 rental revenue was relatively low at $2.38 million, compared to the year-to-date revenue of $6.12 million. This revenue ramp is happening while the company is absorbing significant expenses, evidenced by the Q3 2025 net loss of $(12.1) million and the year-to-date net loss of $(28.4) million. The interest expense alone for Q3 2025 was $4.85 million, largely due to recent debt refinancing.
The competitive pressure is felt most acutely in the near term because of this income gap. You need to watch these key operational indicators closely:
- Q3 2025 Rental Revenue: $2.38 million.
- Q3 2025 Total Expenses: $11.8 million.
- Cash and restricted cash on hand: $35.8 million.
- Leasing for the VIV project began in October 2025, expected to boost Q4 revenue.
- The company must maintain at least $10.0 million in liquid assets per covenants.
If onboarding and lease-up momentum slows, the reliance on existing cash reserves to cover the gap between operating expenses and current rental income increases the short-term competitive risk.
Finance: draft 13-week cash view by Friday.
Belpointe PREP, LLC (OZ) - Porter's Five Forces: Threat of substitutes
You're looking at the competitive landscape for Belpointe PREP, LLC (OZ) as of late 2025, and the substitutes for its Qualified Opportunity Zone Fund structure are significant. The threat here isn't just other real estate plays; it's about alternative ways investors can defer or manage capital gains tax exposure.
Alternative Tax-Advantaged Investments
The primary substitute remains the well-established 1031 Exchange. While proposals to cap deferrals above $500,000 did not pass in recent legislation, the mechanism itself offers a direct alternative for real estate investors seeking tax deferral. Transactional volume for 1031 Exchanges is expected to increase in 2025 due to tax deferral benefits, even with financing hurdles. For comparison, Belpointe PREP, LLC (OZ) has raised aggregate gross offering cash proceeds of $357.3 million as of December 31, 2024.
- 1031 Exchange proposals to cap deferrals above $500,000 did not pass.
- 1031 transactional volume is expected to increase in 2025.
- OZ investors earn an average annual income of $4.9 million.
General Real Estate Development vs. QOZ Structure
Investing in general, non-QOZ real estate development bypasses the specific regulatory framework of the Opportunity Zone program. This means less compliance complexity, though development risk remains. Belpointe PREP, LLC (OZ) had approximately $58 million in assets under construction at the end of Q3 2025, down from more than $190 million at the end of the previous year, indicating a shift away from heavy development spending.
Publicly Traded REITs: Liquidity and Income
Publicly traded Real Estate Investment Trusts (REITs) offer investors immediate liquidity, trading daily on exchanges, a stark contrast to the 10-year lockup for full appreciation benefits in an OZ fund. The FTSE Nareit All REITs equity market capitalization stood at $1.45T in October 2025. The average daily dollar trading volume for REITs in October 2025 was $10.3B. For income seekers, the average dividend yield for U.S. Equity REITs in 2025 is estimated at ~3.9%, compared to Belpointe PREP, LLC (OZ)'s net loss of some $12 million in Q3 2025.
Direct Real Estate Investment
Direct investment in physical assets allows investors to avoid the management fees inherent in a fund structure like Belpointe PREP, LLC (OZ). While Belpointe PREP, LLC (OZ) reported revenues of more than $6 million for the first nine months of 2025 (9M 2025), these revenues are offset by significant operating expenses, reflected in its 9M 2025 net loss exceeding $28 million. Direct ownership avoids the fund-level expenses that contribute to this loss profile.
Legislative Risk to OZ Benefits
Changes to the original 2017 Opportunity Zone legislation pose a direct threat by potentially diminishing the value proposition. The deferral deadline for capital gains tax is December 31, 2026. Furthermore, a narrowing definition of a low-income community is projected to disqualify about 22% of currently designated zones starting in 2027, as the median family income threshold moves from 80% to 70% of the statewide or metropolitan median.
Here's a quick comparison of the substitute investment characteristics versus Belpointe PREP, LLC (OZ) as of late 2025 data points:
| Metric | Publicly Traded REITs (U.S. Equity) | 1031 Exchanges | Belpointe PREP, LLC (OZ) |
| Market Size (Equity Cap/Total Raised) | $1.45T (FTSE Nareit All Equity REITs, Oct 2025) | Volume expected to increase in 2025 | $357.3 million (Aggregate Gross Proceeds as of 12/31/2024) |
| Liquidity | High (Average Daily Volume: $10.3B, Oct 2025) | Medium (Requires finding a like-kind replacement) | Low (Fund structure, 10-year appreciation benefit) |
| Income Yield (2025 Est.) | ~3.9% Average Dividend Yield | Variable, driven by replacement property cash flow | Negative (Net Loss over 9M 2025: over $28 million) |
| Valuation Metric | Trading near or at NAV | N/A | Trading at 0.5x NAV (Last reported NAV: $120/unit) |
| Key Tax Benefit Timing | Standard capital gains/ordinary income treatment | Tax deferral on sale proceeds | Tax-free appreciation if held 10 years; Deferral until Dec 31, 2026 |
The QROF structure offers a 30% basis step-up after five years, which is triple the standard 10% benefit for non-rural QOFs, but this is only relevant for investments in rural zones.
Belpointe PREP, LLC (OZ) - Porter's Five Forces: Threat of new entrants
You're looking at the barriers to entry for new players trying to compete directly with Belpointe PREP, LLC (OZ) in the publicly traded Qualified Opportunity Fund (QOF) space. The hurdles are substantial, rooted in capital scale, regulatory complexity, and first-mover status.
The sheer scale of capital already deployed by Belpointe PREP, LLC (OZ) presents an immediate barrier. New entrants face the challenge of matching this established asset base. Here's a quick look at the scale as of late 2025:
| Metric | Amount as of Q3 2025 |
|---|---|
| Total Assets | $570.8 million |
| Total Development Pipeline (Approximate Total Project Cost) | over $1.3 billion |
| Total Equity Capital Raised (To Date) | more than $345 million |
Regulatory compliance is a significant gatekeeper. Maintaining QOF status requires strict adherence to tests that demand constant asset deployment, making it difficult for cash-heavy newcomers to manage compliance while fundraising. New entrants must navigate the requirement to hold at least 90% of assets in Qualified Opportunity Zone Property (QOZP), a test conducted semi-annually.
- The required QOZP investment threshold is 90%.
- Failure to meet the 90% test can result in penalties.
- The test is measured on the last day of the first 6-month period and the last day of the taxable year.
Belpointe PREP, LLC (OZ) benefits from being the first and only Qualified Opportunity Fund listed on a national securities exchange, which is a unique market position. This first-mover advantage means established trading infrastructure and investor recognition that new funds lack. The company regained compliance with NYSE American listing standards following its 2024 Annual Meeting completion on January 28, 2025, reinforcing its market credibility.
Securing prime development sites in high-growth markets is another practical barrier. New entrants must compete for the best land against established players like Belpointe PREP, LLC (OZ), which has a development pipeline spanning multiple cities and focusing on prime residential and mixed-use developments. Furthermore, the current financing climate adds pressure; while aggregate commercial loan pricing tightened to 2.31% in 3Q 2025, general commercial real estate loan rates were estimated to range from 5% to 14% in mid-2025, making development financing difficult for unproven entities. The projected Federal Funds Rate by late 2025 was cited at 3.9%, indicating rates are expected to remain elevated, defintely increasing the cost of capital for new developers.
Disclaimer
All information, articles, and product details provided on this website are for general informational and educational purposes only. We do not claim any ownership over, nor do we intend to infringe upon, any trademarks, copyrights, logos, brand names, or other intellectual property mentioned or depicted on this site. Such intellectual property remains the property of its respective owners, and any references here are made solely for identification or informational purposes, without implying any affiliation, endorsement, or partnership.
We make no representations or warranties, express or implied, regarding the accuracy, completeness, or suitability of any content or products presented. Nothing on this website should be construed as legal, tax, investment, financial, medical, or other professional advice. In addition, no part of this site—including articles or product references—constitutes a solicitation, recommendation, endorsement, advertisement, or offer to buy or sell any securities, franchises, or other financial instruments, particularly in jurisdictions where such activity would be unlawful.
All content is of a general nature and may not address the specific circumstances of any individual or entity. It is not a substitute for professional advice or services. Any actions you take based on the information provided here are strictly at your own risk. You accept full responsibility for any decisions or outcomes arising from your use of this website and agree to release us from any liability in connection with your use of, or reliance upon, the content or products found herein.