
|
Belpoint Prep, LLC (OZ): 5 Analyse des forces [Jan-2025 MISE À JOUR] |
Entièrement Modifiable: Adapté À Vos Besoins Dans Excel Ou Sheets
Conception Professionnelle: Modèles Fiables Et Conformes Aux Normes Du Secteur
Pré-Construits Pour Une Utilisation Rapide Et Efficace
Compatible MAC/PC, entièrement débloqué
Aucune Expertise N'Est Requise; Facile À Suivre
Belpointe PREP, LLC (OZ) Bundle
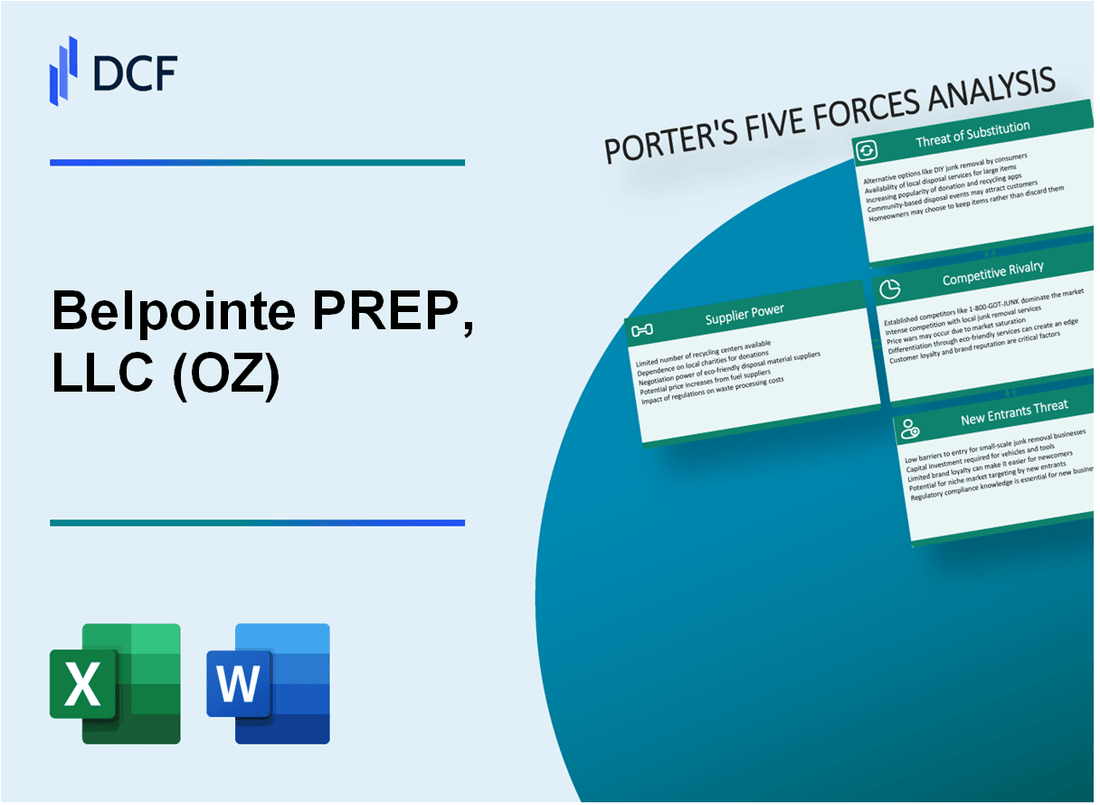
Plongez dans le paysage stratégique de l'écosystème d'investissement de la zone d'opportunité de Belpoint, LLC, où la danse complexe des forces du marché révèle un environnement commercial complexe et nuancé. En disséquant les cinq forces de Michael Porter, nous découvrons la dynamique critique qui façonne le positionnement concurrentiel de cette plate-forme d'investissement spécialisée, de l'équilibre délicat du pouvoir des fournisseurs aux exigences sophistiquées des investisseurs discernés à la recherche d'opportunités transformatrices fiscales dans le développement immobilier et commercial.
Belpointe Prep, LLC (OZ) - Five Forces de Porter: Pouvoir de négociation des fournisseurs
Nombre limité d'administrateurs de fonds de zone d'opportunité spécialisés
En 2024, il y a environ 92 administrateurs de fonds de zone d'opportunité aux États-Unis. Belpoint Prep, LLC opère sur un marché hautement spécialisé avec des options de fournisseurs limitées.
| Catégorie des fournisseurs | Nombre de prestataires | Coût annuel moyen |
|---|---|---|
| Administrateurs de fonds OZ | 92 | $187,500 |
| Consultants en conformité | 43 | $125,000 |
| Services juridiques spécialisés | 37 | $265,000 |
Conformité et expertise réglementaire
Exigences de conformité réglementaire pour les investissements de zone d'opportunité exiger une expertise spécialisée. Le paysage de la conformité implique des réglementations complexes de plusieurs agences fédérales.
- IRS Section 1400Z-2 Conformité aux exigences
- Lignes directrices du Département du Trésor
- Mandats de rapport de la SEC
- Règlement sur la zone d'opportunité au niveau de l'État
Coûts élevés potentiels des services de gestion des fonds spécialisés
Les services de gestion des fonds spécialisés pour les investissements sur les zones d'opportunité démontrent des structures de coûts importantes:
| Type de service | Coût annuel moyen | Gamme de coûts |
|---|---|---|
| Administration de fonds | $187,500 | $150,000 - $225,000 |
| Surveillance de la conformité | $95,000 | $75,000 - $135,000 |
| Services de conseil juridique | $265,000 | $200,000 - $325,000 |
Infrastructure technologique et juridique du marché de niche
L'écosystème d'investissement de la zone d'opportunité nécessite une infrastructure technologique et juridique sophistiquée avec des exigences spécifiques.
- Logiciel de suivi des investissements spécialisés
- Plateformes de gestion de la conformité
- Systèmes de rapports avancés
- Solutions de gestion des données sécurisées
Belpoint Prep, LLC (OZ) - Five Forces de Porter: Pouvoir de négociation des clients
Sophistication des investisseurs élevés dans le paysage d'investissement de zone d'opportunité
Depuis 2024, les investisseurs d'opportunité de zone démontrent des profils d'investissement sophistiqués avec les caractéristiques suivantes:
- Valeur nette médiane: 1,2 million de dollars
- Revenu annuel moyen: 325 000 $
- Investissement en capital typique dans les fonds OZ: 250 000 $ à 750 000 $
| Segment des investisseurs | Pourcentage | Préférence d'investissement |
|---|---|---|
| Individus de valeur nette élevée | 62% | Développement immobilier |
| Investisseurs institutionnels | 23% | Investissement commercial |
| Familiaux | 15% | Portefeuille mixte |
Les investisseurs à la recherche d'investissements immobiliers et commerciaux à avantage fiscale
Réponses fiscales et réduction des gains en capital Mesures pour les investissements sur les zones d'opportunité:
- Représentation fiscale maximale: jusqu'au 31 décembre 2026
- Réduction de l'impôt sur les gains en capital potentiel: jusqu'à 15%
- Économies d'impôt potentielles totales: environ 10 à 15% de l'investissement initial
Demande de gestion des fonds OZ transparent et conforme
| Métrique de conformité | Attente des investisseurs |
|---|---|
| Représentation réglementaire | Divulgations détaillées trimestrielles |
| Suivi des investissements | Surveillance des performances en temps réel |
| Vérification de la conformité | Confirmation d'audit tiers |
Potentiel de choix sélectif des investisseurs parmi les plateformes OZ concurrentes
Métriques de paysage concurrentiel:
- Nombre total de fonds OZ actifs: 327
- Taille moyenne du fonds: 52 millions de dollars
- Taux de commutation de la plate-forme des investisseurs: 18% par an
| Critères de sélection | Classement de priorité des investisseurs |
|---|---|
| Antécédents | 1er |
| Structure des frais | 2e |
| Diversité des investissements | 3e |
Belpoint Prep, LLC (OZ) - Five Forces de Porter: Rivalité compétitive
Nombre croissant de sociétés de gestion de fonds de zone d'opportunité
En 2024, il y a environ 252 fonds de zone d'opportunité qualifiés qui gèrent activement les investissements à l'échelle nationale. Belpointe Prep, LLC opère sur un marché avec environ 15,7 milliards de dollars d'actifs totaux de fonds de zone d'opportunité.
| Catégorie de fonds | Nombre total | Total des actifs sous gestion |
|---|---|---|
| Fonds OZ axé sur l'immobilier | 189 | 12,3 milliards de dollars |
| Fonds d'entreprise / d'entreprise d'exploitation | 63 | 3,4 milliards de dollars |
Différenciation concurrentielle grâce à la stratégie et à la performance d'investissement
Mesures de performance clés pour les fonds de la zone d'opportunité:
- Plage de rendement annuel moyen: 6,2% - 8,7%
- Taille du fonds médian: 42,5 millions de dollars
- Période de détention d'investissement typique: 7-10 ans
La conformité réglementaire comme facteur concurrentiel clé
Les coûts de conformité pour les fonds de la zone d'opportunité en moyenne 275 000 $ par an, représentant un obstacle important à l'entrée du marché.
| Composant de conformité | Coût annuel estimé |
|---|---|
| Services juridiques | $125,000 |
| Comptabilité et rapport | $95,000 |
| Dépôt réglementaire | $55,000 |
Taille du marché limité avec base d'investisseurs concentrés
Demographies des investisseurs pour les fonds de la zone d'opportunité:
- Investisseurs accrédités totaux: 13,9 millions
- Investisseurs estimés du Fonds OZ: 34 500
- Investissement moyen par investisseur: 456 000 $
La concentration géographique montre que 62% des investissements des fonds d'opportunité sont originaires de Californie, de New York et du Texas.
Belpointe Prep, LLC (OZ) - Five Forces de Porter: Menace des substituts
Véhicules d'investissement immobilier traditionnels
Capitalisation boursière de REIT aux États-Unis: 1,3 billion de dollars au quatrième trimestre 2023.
| Véhicule d'investissement | Valeur marchande totale | Retour annuel |
|---|---|---|
| FPI en matière de capitaux propres | 1,1 billion de dollars | 7.2% |
| FRIM hypothécaire | 180 milliards de dollars | 4.5% |
| Investissements immobiliers directs | 500 milliards de dollars | 8.3% |
Stratégies d'investissement alternatives à impôts
Taille totale du marché des investissements à fiscalité fiscale: 27,5 billions de dollars en 2023.
- Section 1031 Échange Volume de transaction totale: 107 milliards de dollars
- Investissements sur zone d'opportunité: 75 milliards de dollars déployés
- Investissements immobiliers IRA auto-dirigés: 42 milliards de dollars
Plateformes de financement participatif et d'investissement numérique émergents
| Plate-forme | Capital total levé | Nombre d'investisseurs |
|---|---|---|
| Collecte de fonds | 2,5 milliards de dollars | 230,000 |
| Realtymogul | 1,8 milliard de dollars | 180,000 |
| Crowdsstreet | 3,2 milliards de dollars | 275,000 |
Options d'investissement en capital-investissement et en capital-risque
Private Equity Real Estate Investment Total Assets: 1,2 billion de dollars en 2023.
| Type d'investissement | Capital total | Rendement moyen |
|---|---|---|
| Capital-investissement immobilier | 850 milliards de dollars | 12.5% |
| Capital de risque immobilier | 350 milliards de dollars | 15.3% |
Belpoint Prep, LLC (OZ) - Five Forces de Porter: Menace de nouveaux entrants
Des obstacles réglementaires importants à l'entrée dans la gestion des fonds OZ
Selon le Département du Trésor américain, en 2023, seuls 349 fonds d'opportunités qualifiés (QOFS) ont été activement enregistrés. Les exigences de conformité réglementaire comprennent:
| Exigence réglementaire | Complexité de conformité |
|---|---|
| Enregistrement de la SEC | Obligatoire pour les fonds de plus de 150 millions de dollars |
| Certification IRS | Test d'investissement en actif strict à 90% |
| Reportage annuel | Formulaire détaillé 8996 Soumission requise |
Exigences élevées de conformité et d'expertise juridique
La gestion des fonds d'opportunité exige une expertise juridique spécialisée:
- Coût de conformité juridique moyen: 75 000 $ - 250 000 $ par an
- Taille minimale de l'équipe juridique: 3-5 avocats spécialisés
- Certifications requises: Série 7, licences de série 63
Capital et infrastructure technologique
| Composant d'infrastructure | Investissement estimé |
|---|---|
| Configuration de la technologie initiale | 500 000 $ - 1,2 million de dollars |
| Systèmes de cybersécurité | 150 000 $ - 350 000 $ par an |
| Logiciel de conformité | 75 000 $ - 200 000 $ par an |
Exigences de connaissances spécialisées
Opportunity Zone Investment Règlement Mandat:
- Période d'investissement minimum: 10 ans
- Connaissances d'impôt sur les gains en capital
- Compréhension détaillée des données économiques au niveau des tracts
Belpointe PREP, LLC (OZ) - Porter's Five Forces: Competitive rivalry
You're analyzing Belpointe PREP, LLC (OZ) in a market where capital flow is heavily influenced by tax incentives, so understanding the competitive rivalry is key. The competition for tax-advantaged capital is definitely a major factor here, putting Belpointe PREP, LLC in a space with numerous private Qualified Opportunity Funds (QOFs).
Direct competition also comes from large, established Real Estate Investment Trusts (REITs) that operate in the same geographic markets as Belpointe PREP, LLC's assets in Florida, Connecticut, and Tennessee. While REITs don't share the QOF structure, their scale and established market presence create a baseline of rivalry for tenants and development opportunities.
Still, Belpointe PREP, LLC's unique structure offers a significant competitive edge against those private QOFs. Belpointe PREP, LLC is the first and only Qualified Opportunity Fund listed on a national securities exchange, the NYSE American under the ticker "OZ". This public listing provides a level of liquidity and transparency that private funds simply cannot match, which is a powerful differentiator for attracting capital.
The company is signaling a long-term, aggressive growth strategy through its development efforts. Here's a quick look at the scale of the operation as of late 2025, which frames the resources being deployed against competitors:
| Metric | Value as of Q3 2025 / Latest Report |
|---|---|
| Total Assets | $570.8 million |
| Debt, net | $251.4 million |
| Total Project Pipeline (Estimated Cost) | Over $1.3 billion |
| Pipeline Units | Over 2,500 units |
| NAV per Class A Unit (as of 6/30/2025) | $116.74 |
This pipeline, representing an approximate total project cost exceeding $1.3 billion, shows Belpointe PREP, LLC is committed to scaling up its asset base significantly.
However, the current operational results show a heavy reliance on the successful lease-up of these new assets to offset costs. The Q3 2025 rental revenue was relatively low at $2.38 million, compared to the year-to-date revenue of $6.12 million. This revenue ramp is happening while the company is absorbing significant expenses, evidenced by the Q3 2025 net loss of $(12.1) million and the year-to-date net loss of $(28.4) million. The interest expense alone for Q3 2025 was $4.85 million, largely due to recent debt refinancing.
The competitive pressure is felt most acutely in the near term because of this income gap. You need to watch these key operational indicators closely:
- Q3 2025 Rental Revenue: $2.38 million.
- Q3 2025 Total Expenses: $11.8 million.
- Cash and restricted cash on hand: $35.8 million.
- Leasing for the VIV project began in October 2025, expected to boost Q4 revenue.
- The company must maintain at least $10.0 million in liquid assets per covenants.
If onboarding and lease-up momentum slows, the reliance on existing cash reserves to cover the gap between operating expenses and current rental income increases the short-term competitive risk.
Finance: draft 13-week cash view by Friday.
Belpointe PREP, LLC (OZ) - Porter's Five Forces: Threat of substitutes
You're looking at the competitive landscape for Belpointe PREP, LLC (OZ) as of late 2025, and the substitutes for its Qualified Opportunity Zone Fund structure are significant. The threat here isn't just other real estate plays; it's about alternative ways investors can defer or manage capital gains tax exposure.
Alternative Tax-Advantaged Investments
The primary substitute remains the well-established 1031 Exchange. While proposals to cap deferrals above $500,000 did not pass in recent legislation, the mechanism itself offers a direct alternative for real estate investors seeking tax deferral. Transactional volume for 1031 Exchanges is expected to increase in 2025 due to tax deferral benefits, even with financing hurdles. For comparison, Belpointe PREP, LLC (OZ) has raised aggregate gross offering cash proceeds of $357.3 million as of December 31, 2024.
- 1031 Exchange proposals to cap deferrals above $500,000 did not pass.
- 1031 transactional volume is expected to increase in 2025.
- OZ investors earn an average annual income of $4.9 million.
General Real Estate Development vs. QOZ Structure
Investing in general, non-QOZ real estate development bypasses the specific regulatory framework of the Opportunity Zone program. This means less compliance complexity, though development risk remains. Belpointe PREP, LLC (OZ) had approximately $58 million in assets under construction at the end of Q3 2025, down from more than $190 million at the end of the previous year, indicating a shift away from heavy development spending.
Publicly Traded REITs: Liquidity and Income
Publicly traded Real Estate Investment Trusts (REITs) offer investors immediate liquidity, trading daily on exchanges, a stark contrast to the 10-year lockup for full appreciation benefits in an OZ fund. The FTSE Nareit All REITs equity market capitalization stood at $1.45T in October 2025. The average daily dollar trading volume for REITs in October 2025 was $10.3B. For income seekers, the average dividend yield for U.S. Equity REITs in 2025 is estimated at ~3.9%, compared to Belpointe PREP, LLC (OZ)'s net loss of some $12 million in Q3 2025.
Direct Real Estate Investment
Direct investment in physical assets allows investors to avoid the management fees inherent in a fund structure like Belpointe PREP, LLC (OZ). While Belpointe PREP, LLC (OZ) reported revenues of more than $6 million for the first nine months of 2025 (9M 2025), these revenues are offset by significant operating expenses, reflected in its 9M 2025 net loss exceeding $28 million. Direct ownership avoids the fund-level expenses that contribute to this loss profile.
Legislative Risk to OZ Benefits
Changes to the original 2017 Opportunity Zone legislation pose a direct threat by potentially diminishing the value proposition. The deferral deadline for capital gains tax is December 31, 2026. Furthermore, a narrowing definition of a low-income community is projected to disqualify about 22% of currently designated zones starting in 2027, as the median family income threshold moves from 80% to 70% of the statewide or metropolitan median.
Here's a quick comparison of the substitute investment characteristics versus Belpointe PREP, LLC (OZ) as of late 2025 data points:
| Metric | Publicly Traded REITs (U.S. Equity) | 1031 Exchanges | Belpointe PREP, LLC (OZ) |
| Market Size (Equity Cap/Total Raised) | $1.45T (FTSE Nareit All Equity REITs, Oct 2025) | Volume expected to increase in 2025 | $357.3 million (Aggregate Gross Proceeds as of 12/31/2024) |
| Liquidity | High (Average Daily Volume: $10.3B, Oct 2025) | Medium (Requires finding a like-kind replacement) | Low (Fund structure, 10-year appreciation benefit) |
| Income Yield (2025 Est.) | ~3.9% Average Dividend Yield | Variable, driven by replacement property cash flow | Negative (Net Loss over 9M 2025: over $28 million) |
| Valuation Metric | Trading near or at NAV | N/A | Trading at 0.5x NAV (Last reported NAV: $120/unit) |
| Key Tax Benefit Timing | Standard capital gains/ordinary income treatment | Tax deferral on sale proceeds | Tax-free appreciation if held 10 years; Deferral until Dec 31, 2026 |
The QROF structure offers a 30% basis step-up after five years, which is triple the standard 10% benefit for non-rural QOFs, but this is only relevant for investments in rural zones.
Belpointe PREP, LLC (OZ) - Porter's Five Forces: Threat of new entrants
You're looking at the barriers to entry for new players trying to compete directly with Belpointe PREP, LLC (OZ) in the publicly traded Qualified Opportunity Fund (QOF) space. The hurdles are substantial, rooted in capital scale, regulatory complexity, and first-mover status.
The sheer scale of capital already deployed by Belpointe PREP, LLC (OZ) presents an immediate barrier. New entrants face the challenge of matching this established asset base. Here's a quick look at the scale as of late 2025:
| Metric | Amount as of Q3 2025 |
|---|---|
| Total Assets | $570.8 million |
| Total Development Pipeline (Approximate Total Project Cost) | over $1.3 billion |
| Total Equity Capital Raised (To Date) | more than $345 million |
Regulatory compliance is a significant gatekeeper. Maintaining QOF status requires strict adherence to tests that demand constant asset deployment, making it difficult for cash-heavy newcomers to manage compliance while fundraising. New entrants must navigate the requirement to hold at least 90% of assets in Qualified Opportunity Zone Property (QOZP), a test conducted semi-annually.
- The required QOZP investment threshold is 90%.
- Failure to meet the 90% test can result in penalties.
- The test is measured on the last day of the first 6-month period and the last day of the taxable year.
Belpointe PREP, LLC (OZ) benefits from being the first and only Qualified Opportunity Fund listed on a national securities exchange, which is a unique market position. This first-mover advantage means established trading infrastructure and investor recognition that new funds lack. The company regained compliance with NYSE American listing standards following its 2024 Annual Meeting completion on January 28, 2025, reinforcing its market credibility.
Securing prime development sites in high-growth markets is another practical barrier. New entrants must compete for the best land against established players like Belpointe PREP, LLC (OZ), which has a development pipeline spanning multiple cities and focusing on prime residential and mixed-use developments. Furthermore, the current financing climate adds pressure; while aggregate commercial loan pricing tightened to 2.31% in 3Q 2025, general commercial real estate loan rates were estimated to range from 5% to 14% in mid-2025, making development financing difficult for unproven entities. The projected Federal Funds Rate by late 2025 was cited at 3.9%, indicating rates are expected to remain elevated, defintely increasing the cost of capital for new developers.
Disclaimer
All information, articles, and product details provided on this website are for general informational and educational purposes only. We do not claim any ownership over, nor do we intend to infringe upon, any trademarks, copyrights, logos, brand names, or other intellectual property mentioned or depicted on this site. Such intellectual property remains the property of its respective owners, and any references here are made solely for identification or informational purposes, without implying any affiliation, endorsement, or partnership.
We make no representations or warranties, express or implied, regarding the accuracy, completeness, or suitability of any content or products presented. Nothing on this website should be construed as legal, tax, investment, financial, medical, or other professional advice. In addition, no part of this site—including articles or product references—constitutes a solicitation, recommendation, endorsement, advertisement, or offer to buy or sell any securities, franchises, or other financial instruments, particularly in jurisdictions where such activity would be unlawful.
All content is of a general nature and may not address the specific circumstances of any individual or entity. It is not a substitute for professional advice or services. Any actions you take based on the information provided here are strictly at your own risk. You accept full responsibility for any decisions or outcomes arising from your use of this website and agree to release us from any liability in connection with your use of, or reliance upon, the content or products found herein.