
|
Valoración DCF de PagerDuty, Inc. (PD) |
Completamente Editable: Adáptelo A Sus Necesidades En Excel O Sheets
Diseño Profesional: Plantillas Confiables Y Estándares De La Industria
Predeterminadas Para Un Uso Rápido Y Eficiente
Compatible con MAC / PC, completamente desbloqueado
No Se Necesita Experiencia; Fáciles De Seguir
PagerDuty, Inc. (PD) Bundle
¡Maximice la eficiencia y mejore la precisión con nuestra calculadora DCF (PD)! Utilizando datos reales de PagerDuty, Inc. y suposiciones personalizables, esta herramienta le permite pronosticar, analizar y evaluar (PD) como un inversor experimentado.
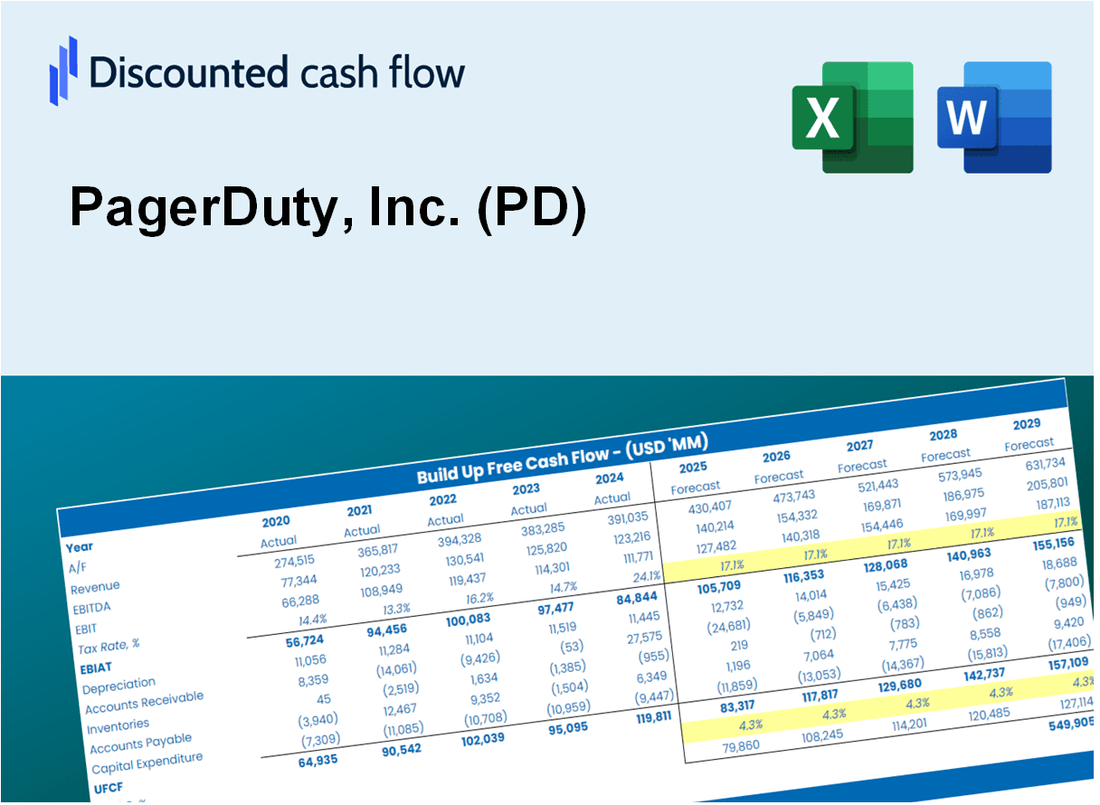
Discounted Cash Flow (DCF) - (USD MM)
| Year | AY1 2021 |
AY2 2022 |
AY3 2023 |
AY4 2024 |
AY5 2025 |
FY1 2026 |
FY2 2027 |
FY3 2028 |
FY4 2029 |
FY5 2030 |
|---|---|---|---|---|---|---|---|---|---|---|
| Revenue | 213.6 | 281.4 | 370.8 | 430.7 | 467.5 | 570.6 | 696.5 | 850.1 | 1,037.7 | 1,266.6 |
| Revenue Growth, % | 0 | 31.77 | 31.77 | 16.16 | 8.54 | 22.06 | 22.06 | 22.06 | 22.06 | 22.06 |
| EBITDA | -57.6 | -93.4 | -107.2 | -52.8 | -11.9 | -118.5 | -144.7 | -176.6 | -215.5 | -263.1 |
| EBITDA, % | -26.96 | -33.18 | -28.91 | -12.26 | -2.54 | -20.77 | -20.77 | -20.77 | -20.77 | -20.77 |
| Depreciation | 20.6 | 12.8 | 40.7 | 20.2 | 20.6 | 39.1 | 47.8 | 58.3 | 71.2 | 86.9 |
| Depreciation, % | 9.67 | 4.56 | 10.99 | 4.68 | 4.41 | 6.86 | 6.86 | 6.86 | 6.86 | 6.86 |
| EBIT | -78.2 | -106.2 | -148.0 | -73.0 | -32.5 | -157.7 | -192.4 | -234.9 | -286.7 | -350.0 |
| EBIT, % | -36.63 | -37.73 | -39.9 | -16.94 | -6.95 | -27.63 | -27.63 | -27.63 | -27.63 | -27.63 |
| Total Cash | 560.3 | 543.4 | 477.0 | 571.2 | 570.8 | 570.6 | 696.5 | 850.1 | 1,037.7 | 1,266.6 |
| Total Cash, percent | .0 | .0 | .0 | .0 | .0 | .0 | .0 | .0 | .0 | .0 |
| Account Receivables | 55.1 | 75.3 | 91.3 | 100.4 | 107.4 | 140.9 | 172.0 | 209.9 | 256.3 | 312.8 |
| Account Receivables, % | 25.81 | 26.75 | 24.64 | 23.31 | 22.96 | 24.69 | 24.69 | 24.69 | 24.69 | 24.69 |
| Inventories | -221.1 | .0 | 18.7 | .0 | .0 | -108.4 | -132.3 | -161.5 | -197.1 | -240.6 |
| Inventories, % | -103.54 | 0 | 5.04 | 0 | 0 | -18.99 | -18.99 | -18.99 | -18.99 | -18.99 |
| Accounts Payable | 5.7 | 9.5 | 7.4 | 6.2 | 7.3 | 12.6 | 15.4 | 18.8 | 23.0 | 28.1 |
| Accounts Payable, % | 2.69 | 3.38 | 2 | 1.45 | 1.57 | 2.22 | 2.22 | 2.22 | 2.22 | 2.22 |
| Capital Expenditure | -4.8 | -6.8 | -8.5 | -7.5 | -9.5 | -12.3 | -15.0 | -18.3 | -22.3 | -27.2 |
| Capital Expenditure, % | -2.27 | -2.42 | -2.29 | -1.75 | -2.03 | -2.15 | -2.15 | -2.15 | -2.15 | -2.15 |
| Tax Rate, % | -2.35 | -2.35 | -2.35 | -2.35 | -2.35 | -2.35 | -2.35 | -2.35 | -2.35 | -2.35 |
| EBITAT | -74.0 | -106.7 | -147.0 | -77.1 | -33.3 | -155.8 | -190.1 | -232.1 | -283.3 | -345.7 |
| Depreciation | ||||||||||
| Changes in Account Receivables | ||||||||||
| Changes in Inventories | ||||||||||
| Changes in Accounts Payable | ||||||||||
| Capital Expenditure | ||||||||||
| UFCF | 113.5 | -338.2 | -151.6 | -56.0 | -28.0 | -48.8 | -161.7 | -197.4 | -240.9 | -294.1 |
| WACC, % | 6.61 | 6.66 | 6.65 | 6.66 | 6.66 | 6.65 | 6.65 | 6.65 | 6.65 | 6.65 |
| PV UFCF | ||||||||||
| SUM PV UFCF | -750.0 | |||||||||
| Long Term Growth Rate, % | 2.00 | |||||||||
| Free cash flow (T + 1) | -300 | |||||||||
| Terminal Value | -6,452 | |||||||||
| Present Terminal Value | -4,677 | |||||||||
| Enterprise Value | -5,427 | |||||||||
| Net Debt | 117 | |||||||||
| Equity Value | -5,544 | |||||||||
| Diluted Shares Outstanding, MM | 92 | |||||||||
| Equity Value Per Share | -60.26 |
What You Will Get
- Real PagerDuty Data: Preloaded financials – from revenue to EBIT – based on actual and projected figures.
- Full Customization: Adjust all critical parameters (yellow cells) like WACC, growth %, and tax rates.
- Instant Valuation Updates: Automatic recalculations to analyze the impact of changes on PagerDuty’s fair value.
- Versatile Excel Template: Tailored for quick edits, scenario testing, and detailed projections.
- Time-Saving and Accurate: Skip building models from scratch while maintaining precision and flexibility.
Key Features
- Comprehensive PD Data: Pre-loaded with PagerDuty’s historical performance metrics and future growth estimates.
- Customizable Parameters: Tailor revenue forecasts, profit margins, discount rates, tax implications, and capital investments.
- Adaptive Valuation Framework: Real-time adjustments to Net Present Value (NPV) and intrinsic value based on user-defined parameters.
- Scenario Analysis: Develop various forecasting scenarios to evaluate differing valuation results.
- Intuitive Interface: Clean, organized, and built for both experienced users and newcomers.
How It Works
- 1. Open the Template: Download and open the Excel file containing PagerDuty’s preloaded data.
- 2. Edit Assumptions: Modify key inputs such as growth rates, WACC, and capital expenditures.
- 3. View Results Instantly: The DCF model automatically calculates the intrinsic value and NPV.
- 4. Test Scenarios: Analyze different valuation outcomes by comparing multiple forecasts.
- 5. Use with Confidence: Present professional valuation insights to support your decision-making.
Why Choose PagerDuty's Solutions?
- Enhance Efficiency: Streamline incident management with our ready-to-use platform.
- Boost Reliability: Our robust system minimizes downtime and enhances service delivery.
- Highly Adaptable: Customize features to align with your team's unique workflows.
- User-Friendly Interface: Intuitive design ensures easy navigation and quick access to insights.
- Preferred by Industry Leaders: Trusted by top organizations for its effectiveness and innovation.
Who Should Use This Product?
- Professional Investors: Develop comprehensive and accurate valuation models for portfolio assessment.
- Corporate Finance Teams: Evaluate valuation scenarios to inform strategic decisions.
- Consultants and Advisors: Deliver precise valuation insights for PagerDuty, Inc. (PD) to clients.
- Students and Educators: Utilize real-world data to enhance financial modeling education.
- Tech Enthusiasts: Gain insights into how tech companies like PagerDuty, Inc. (PD) are assessed in the market.
What the Template Contains
- Comprehensive DCF Model: Editable template featuring detailed valuation calculations for PagerDuty, Inc. (PD).
- Real-World Data: PagerDuty’s historical and projected financials preloaded for in-depth analysis.
- Customizable Parameters: Modify WACC, growth rates, and tax assumptions to explore various scenarios.
- Financial Statements: Complete annual and quarterly breakdowns for enhanced insights.
- Key Ratios: Integrated analysis for profitability, efficiency, and leverage metrics.
- Dashboard with Visual Outputs: Charts and tables designed for clear, actionable results.
Disclaimer
All information, articles, and product details provided on this website are for general informational and educational purposes only. We do not claim any ownership over, nor do we intend to infringe upon, any trademarks, copyrights, logos, brand names, or other intellectual property mentioned or depicted on this site. Such intellectual property remains the property of its respective owners, and any references here are made solely for identification or informational purposes, without implying any affiliation, endorsement, or partnership.
We make no representations or warranties, express or implied, regarding the accuracy, completeness, or suitability of any content or products presented. Nothing on this website should be construed as legal, tax, investment, financial, medical, or other professional advice. In addition, no part of this site—including articles or product references—constitutes a solicitation, recommendation, endorsement, advertisement, or offer to buy or sell any securities, franchises, or other financial instruments, particularly in jurisdictions where such activity would be unlawful.
All content is of a general nature and may not address the specific circumstances of any individual or entity. It is not a substitute for professional advice or services. Any actions you take based on the information provided here are strictly at your own risk. You accept full responsibility for any decisions or outcomes arising from your use of this website and agree to release us from any liability in connection with your use of, or reliance upon, the content or products found herein.