
|
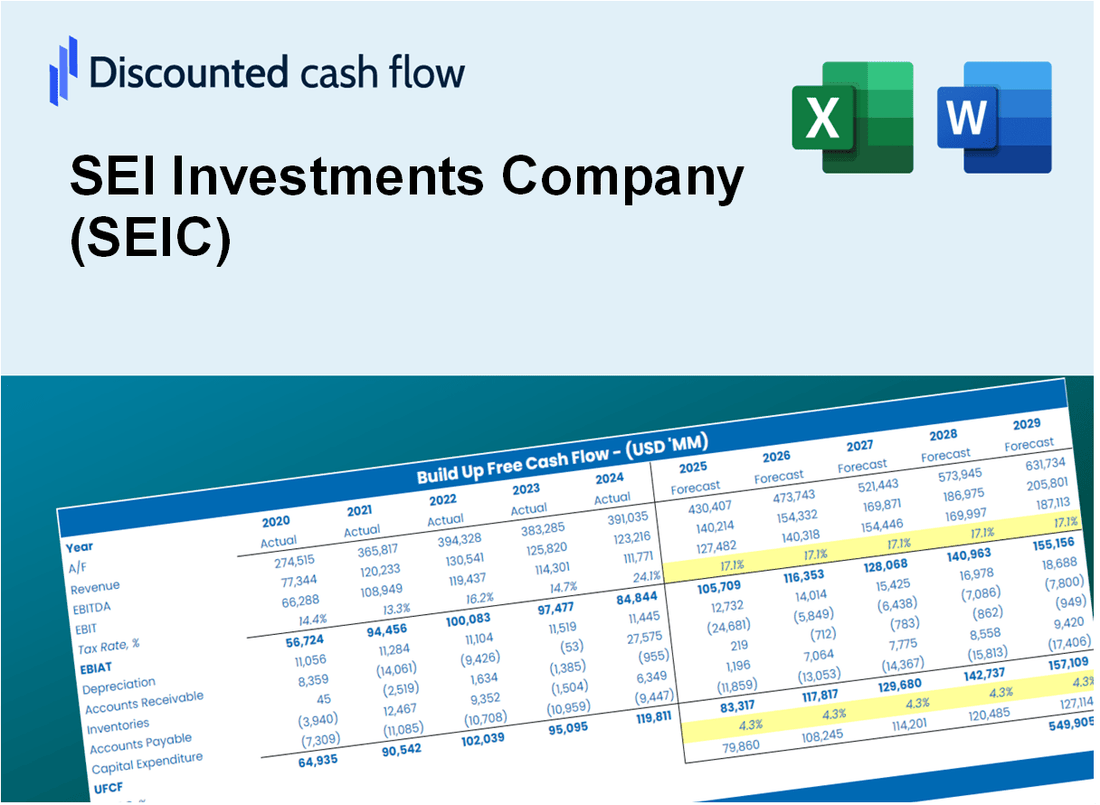
Valoración DCF de SEI Investments Company (SEIC) |
Completamente Editable: Adáptelo A Sus Necesidades En Excel O Sheets
Diseño Profesional: Plantillas Confiables Y Estándares De La Industria
Predeterminadas Para Un Uso Rápido Y Eficiente
Compatible con MAC / PC, completamente desbloqueado
No Se Necesita Experiencia; Fáciles De Seguir
SEI Investments Company (SEIC) Bundle
¡Explore el futuro financiero de SEI Investments Company (SEIC) con nuestra calculadora DCF fácil de usar! Ingrese sus proyecciones para el crecimiento, los márgenes y los gastos para determinar el valor intrínseco (SEIC) de la Compañía de Inversiones SEI y mejorar su estrategia de inversión.
Discounted Cash Flow (DCF) - (USD MM)
| Year | AY1 2020 |
AY2 2021 |
AY3 2022 |
AY4 2023 |
AY5 2024 |
FY1 2025 |
FY2 2026 |
FY3 2027 |
FY4 2028 |
FY5 2029 |
|---|---|---|---|---|---|---|---|---|---|---|
| Revenue | 1,684.1 | 1,918.3 | 1,991.0 | 1,919.8 | 2,125.2 | 2,257.0 | 2,397.1 | 2,545.8 | 2,703.8 | 2,871.5 |
| Revenue Growth, % | 0 | 13.91 | 3.79 | -3.58 | 10.7 | 6.2 | 6.2 | 6.2 | 6.2 | 6.2 |
| EBITDA | 530.4 | 646.9 | 561.2 | 669.2 | 822.5 | 753.7 | 800.5 | 850.2 | 902.9 | 958.9 |
| EBITDA, % | 31.5 | 33.72 | 28.19 | 34.86 | 38.71 | 33.39 | 33.39 | 33.39 | 33.39 | 33.39 |
| Depreciation | 83.9 | 92.6 | 87.9 | 74.0 | 75.2 | 97.6 | 103.7 | 110.1 | 116.9 | 124.2 |
| Depreciation, % | 4.98 | 4.83 | 4.42 | 3.85 | 3.54 | 4.32 | 4.32 | 4.32 | 4.32 | 4.32 |
| EBIT | 446.5 | 554.3 | 473.3 | 595.2 | 747.3 | 656.1 | 696.8 | 740.1 | 786.0 | 834.8 |
| EBIT, % | 26.51 | 28.89 | 23.77 | 31.01 | 35.17 | 29.07 | 29.07 | 29.07 | 29.07 | 29.07 |
| Total Cash | 818.7 | 859.7 | 885.2 | 866.0 | 869.5 | 1,010.7 | 1,073.4 | 1,140.1 | 1,210.8 | 1,285.9 |
| Total Cash, percent | .0 | .0 | .0 | .0 | .0 | .0 | .0 | .0 | .0 | .0 |
| Account Receivables | 440.5 | 500.6 | 519.1 | 557.3 | 621.8 | 616.7 | 654.9 | 695.6 | 738.7 | 784.6 |
| Account Receivables, % | 26.16 | 26.1 | 26.07 | 29.03 | 29.26 | 27.32 | 27.32 | 27.32 | 27.32 | 27.32 |
| Inventories | .0 | .0 | .0 | .0 | .0 | .0 | .0 | .0 | .0 | .0 |
| Inventories, % | 0 | 0 | 0 | 0 | 0 | 0 | 0 | 0 | 0 | 0 |
| Accounts Payable | 7.8 | 10.3 | 13.3 | 10.6 | 13.1 | 12.8 | 13.6 | 14.4 | 15.3 | 16.3 |
| Accounts Payable, % | 0.46115 | 0.53756 | 0.66714 | 0.55308 | 0.61553 | 0.56689 | 0.56689 | 0.56689 | 0.56689 | 0.56689 |
| Capital Expenditure | -78.6 | -52.5 | -74.5 | -58.8 | -56.6 | -76.1 | -80.9 | -85.9 | -91.2 | -96.9 |
| Capital Expenditure, % | -4.67 | -2.74 | -3.74 | -3.06 | -2.66 | -3.37 | -3.37 | -3.37 | -3.37 | -3.37 |
| Tax Rate, % | 22.17 | 22.17 | 22.17 | 22.17 | 22.17 | 22.17 | 22.17 | 22.17 | 22.17 | 22.17 |
| EBITAT | 351.2 | 436.8 | 369.3 | 462.7 | 581.6 | 513.1 | 545.0 | 578.8 | 614.7 | 652.9 |
| Depreciation | ||||||||||
| Changes in Account Receivables | ||||||||||
| Changes in Inventories | ||||||||||
| Changes in Accounts Payable | ||||||||||
| Capital Expenditure | ||||||||||
| UFCF | -76.2 | 419.3 | 367.3 | 437.0 | 538.3 | 539.4 | 530.3 | 563.2 | 598.2 | 635.3 |
| WACC, % | 8.36 | 8.36 | 8.36 | 8.36 | 8.36 | 8.36 | 8.36 | 8.36 | 8.36 | 8.36 |
| PV UFCF | ||||||||||
| SUM PV UFCF | 2,251.2 | |||||||||
| Long Term Growth Rate, % | 2.00 | |||||||||
| Free cash flow (T + 1) | 648 | |||||||||
| Terminal Value | 10,190 | |||||||||
| Present Terminal Value | 6,821 | |||||||||
| Enterprise Value | 9,072 | |||||||||
| Net Debt | -808 | |||||||||
| Equity Value | 9,880 | |||||||||
| Diluted Shares Outstanding, MM | 132 | |||||||||
| Equity Value Per Share | 75.01 |
What You Will Get
- Real SEI Data: Preloaded financials – from revenue to EBIT – based on actual and projected figures for SEI Investments Company (SEIC).
- Full Customization: Adjust all critical parameters (yellow cells) like WACC, growth %, and tax rates to fit SEI's unique context.
- Instant Valuation Updates: Automatic recalculations to analyze the impact of changes on SEI’s fair value.
- Versatile Excel Template: Tailored for quick edits, scenario testing, and detailed projections specific to SEI Investments Company (SEIC).
- Time-Saving and Accurate: Skip building models from scratch while maintaining precision and flexibility for SEI's financial analysis.
Key Features
- Customizable Investment Parameters: Adjust essential inputs such as asset allocation, risk tolerance, and investment horizon.
- Instant Portfolio Valuation: Quickly calculates portfolio performance, returns, and risk metrics.
- Industry-Leading Precision: Leverages SEI's extensive market data for accurate investment insights.
- Seamless Scenario Analysis: Explore various investment scenarios and easily assess their impact.
- Efficiency Booster: Streamline your investment analysis without the hassle of complex spreadsheets.
How It Works
- Step 1: Download the prebuilt Excel template featuring SEI Investments Company's (SEIC) data.
- Step 2: Navigate through the pre-filled sheets to familiarize yourself with the essential metrics.
- Step 3: Modify forecasts and assumptions in the editable yellow cells (WACC, growth, margins).
- Step 4: Instantly see the recalculated results, including SEI Investments Company's (SEIC) intrinsic value.
- Step 5: Utilize the outputs to make informed investment decisions or generate detailed reports.
Why Choose SEI Investments Company (SEIC)?
- Streamlined Processes: Access comprehensive investment solutions without the hassle of complex setups.
- Enhanced Precision: Utilize robust financial analytics that minimize discrepancies in investment strategies.
- Completely Adaptable: Modify services to align with your unique investment goals and market conditions.
- User-Friendly Interface: Intuitive dashboards and reports simplify the decision-making process.
- Endorsed by Professionals: A trusted partner for investors who prioritize accuracy and efficiency.
Who Should Use This Product?
- Investors: Evaluate SEI Investments Company's (SEIC) performance before making investment decisions.
- CFOs and Financial Analysts: Enhance valuation methodologies and validate financial forecasts.
- Startup Founders: Understand the valuation strategies of established firms like SEI Investments Company.
- Consultants: Provide comprehensive valuation analyses for their clientele.
- Students and Educators: Utilize current data to explore and instruct valuation concepts.
What the Template Contains
- Comprehensive DCF Model: Editable template featuring detailed valuation calculations for SEI Investments Company (SEIC).
- Real-World Data: SEI Investments Company's historical and projected financials preloaded for in-depth analysis.
- Customizable Parameters: Modify WACC, growth rates, and tax assumptions to explore various scenarios.
- Financial Statements: Complete annual and quarterly breakdowns for enhanced insights into SEIC's performance.
- Key Ratios: Integrated analysis for assessing profitability, efficiency, and leverage specific to SEI Investments Company (SEIC).
- Dashboard with Visual Outputs: Engaging charts and tables for clear, actionable results tailored to SEIC.
Disclaimer
All information, articles, and product details provided on this website are for general informational and educational purposes only. We do not claim any ownership over, nor do we intend to infringe upon, any trademarks, copyrights, logos, brand names, or other intellectual property mentioned or depicted on this site. Such intellectual property remains the property of its respective owners, and any references here are made solely for identification or informational purposes, without implying any affiliation, endorsement, or partnership.
We make no representations or warranties, express or implied, regarding the accuracy, completeness, or suitability of any content or products presented. Nothing on this website should be construed as legal, tax, investment, financial, medical, or other professional advice. In addition, no part of this site—including articles or product references—constitutes a solicitation, recommendation, endorsement, advertisement, or offer to buy or sell any securities, franchises, or other financial instruments, particularly in jurisdictions where such activity would be unlawful.
All content is of a general nature and may not address the specific circumstances of any individual or entity. It is not a substitute for professional advice or services. Any actions you take based on the information provided here are strictly at your own risk. You accept full responsibility for any decisions or outcomes arising from your use of this website and agree to release us from any liability in connection with your use of, or reliance upon, the content or products found herein.