
|
Valoración DCF de Verint Systems Inc. (VRNT) |
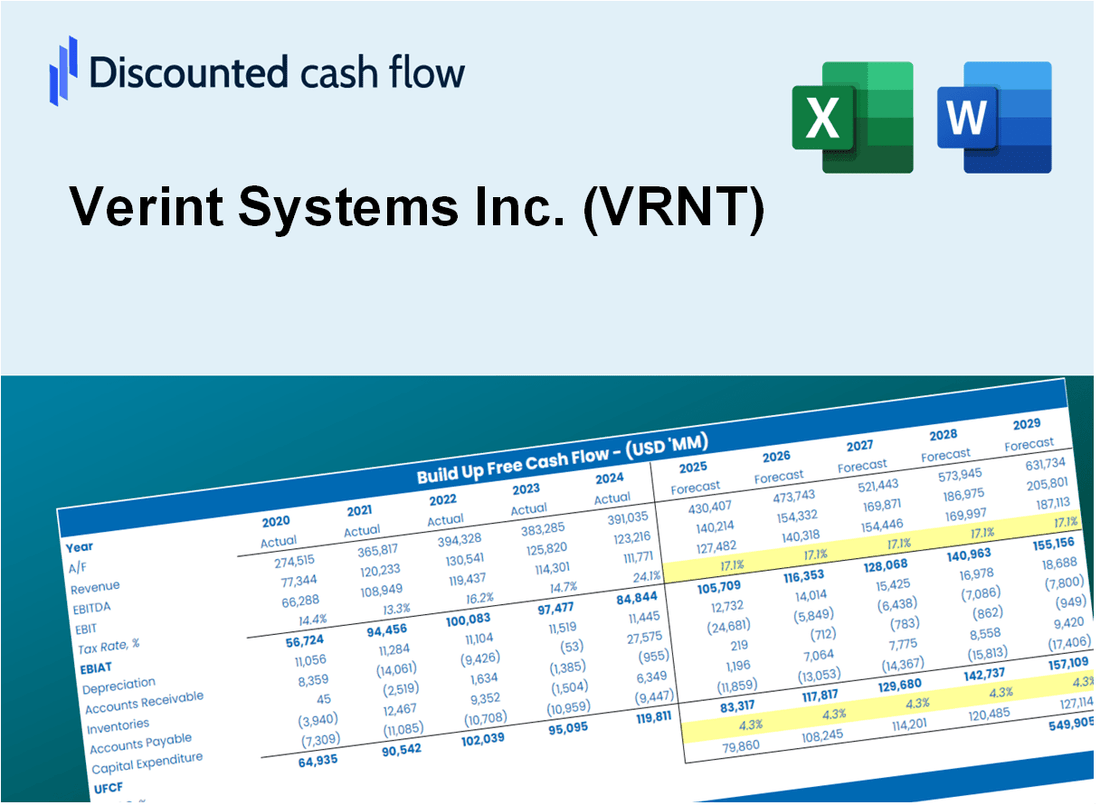
Completamente Editable: Adáptelo A Sus Necesidades En Excel O Sheets
Diseño Profesional: Plantillas Confiables Y Estándares De La Industria
Predeterminadas Para Un Uso Rápido Y Eficiente
Compatible con MAC / PC, completamente desbloqueado
No Se Necesita Experiencia; Fáciles De Seguir
Verint Systems Inc. (VRNT) Bundle
¡Agilice su análisis y mejore la precisión con nuestra calculadora DCF (VRNT)! Equipado con datos actualizados de Verint Systems Inc. y suposiciones personalizables, esta herramienta le permite pronosticar, evaluar y evaluar (VRNT) como un inversor experimentado.
What You Will Get
- Comprehensive VRNT Financials: Access to historical and projected data for precise valuation.
- Customizable Inputs: Adjust WACC, tax rates, revenue growth, and capital expenditures as needed.
- Dynamic Calculations: Intrinsic value and NPV are computed in real-time.
- Scenario Analysis: Evaluate various scenarios to assess Verint’s future performance.
- User-Friendly Design: Designed for professionals while remaining approachable for newcomers.
Key Features
- Comprehensive DCF Calculator: Features detailed unlevered and levered DCF valuation models tailored for Verint Systems Inc. (VRNT).
- WACC Calculator: Pre-configured Weighted Average Cost of Capital sheet with adjustable inputs specific to VRNT.
- Customizable Forecast Assumptions: Easily alter growth rates, capital expenditures, and discount rates for accurate projections.
- Integrated Financial Ratios: Evaluate profitability, leverage, and efficiency ratios relevant to Verint Systems Inc. (VRNT).
- Interactive Dashboard and Charts: Visual representations summarize essential valuation metrics for straightforward analysis.
How It Works
- Step 1: Download the Excel file.
- Step 2: Review Verint Systems Inc.’s pre-filled financial data and forecasts.
- Step 3: Modify critical inputs like revenue growth, WACC, and tax rates (highlighted cells).
- Step 4: Watch the DCF model update instantly as you tweak assumptions.
- Step 5: Analyze the outputs and use the results for investment decisions.
Why Choose This Calculator for Verint Systems Inc. (VRNT)?
- All-in-One Solution: Combines DCF, WACC, and financial ratio analyses tailored for Verint Systems Inc. (VRNT).
- Flexible Inputs: Modify yellow-highlighted cells to explore different financial scenarios.
- In-Depth Analysis: Automatically computes Verint's intrinsic value and Net Present Value.
- Preloaded Information: Historical and projected data provide reliable starting points for analysis.
- High-Quality Standards: Perfect for financial analysts, investors, and business consultants focused on Verint Systems Inc. (VRNT).
Who Should Use This Product?
- Individual Investors: Gain insights for making informed decisions regarding Verint Systems Inc. (VRNT) stock transactions.
- Financial Analysts: Enhance valuation methodologies with accessible financial models tailored for Verint Systems Inc. (VRNT).
- Consultants: Provide clients with accurate and timely valuation analyses of Verint Systems Inc. (VRNT).
- Business Owners: Learn how companies like Verint Systems Inc. (VRNT) are valued to inform your business strategy.
- Finance Students: Acquire practical valuation skills through the analysis of real-world data from Verint Systems Inc. (VRNT).
What the Verint Systems Template Contains
- Comprehensive DCF Model: Editable template with detailed valuation calculations tailored for Verint Systems Inc. (VRNT).
- Real-World Data: Verint’s historical and projected financials preloaded for thorough analysis.
- Customizable Parameters: Modify WACC, growth rates, and tax assumptions to explore various scenarios.
- Financial Statements: Complete annual and quarterly breakdowns for enhanced insights into Verint's performance.
- Key Ratios: Integrated analysis for profitability, efficiency, and leverage metrics relevant to Verint Systems Inc. (VRNT).
- Dashboard with Visual Outputs: Engaging charts and tables for clear, actionable insights.
Disclaimer
All information, articles, and product details provided on this website are for general informational and educational purposes only. We do not claim any ownership over, nor do we intend to infringe upon, any trademarks, copyrights, logos, brand names, or other intellectual property mentioned or depicted on this site. Such intellectual property remains the property of its respective owners, and any references here are made solely for identification or informational purposes, without implying any affiliation, endorsement, or partnership.
We make no representations or warranties, express or implied, regarding the accuracy, completeness, or suitability of any content or products presented. Nothing on this website should be construed as legal, tax, investment, financial, medical, or other professional advice. In addition, no part of this site—including articles or product references—constitutes a solicitation, recommendation, endorsement, advertisement, or offer to buy or sell any securities, franchises, or other financial instruments, particularly in jurisdictions where such activity would be unlawful.
All content is of a general nature and may not address the specific circumstances of any individual or entity. It is not a substitute for professional advice or services. Any actions you take based on the information provided here are strictly at your own risk. You accept full responsibility for any decisions or outcomes arising from your use of this website and agree to release us from any liability in connection with your use of, or reliance upon, the content or products found herein.